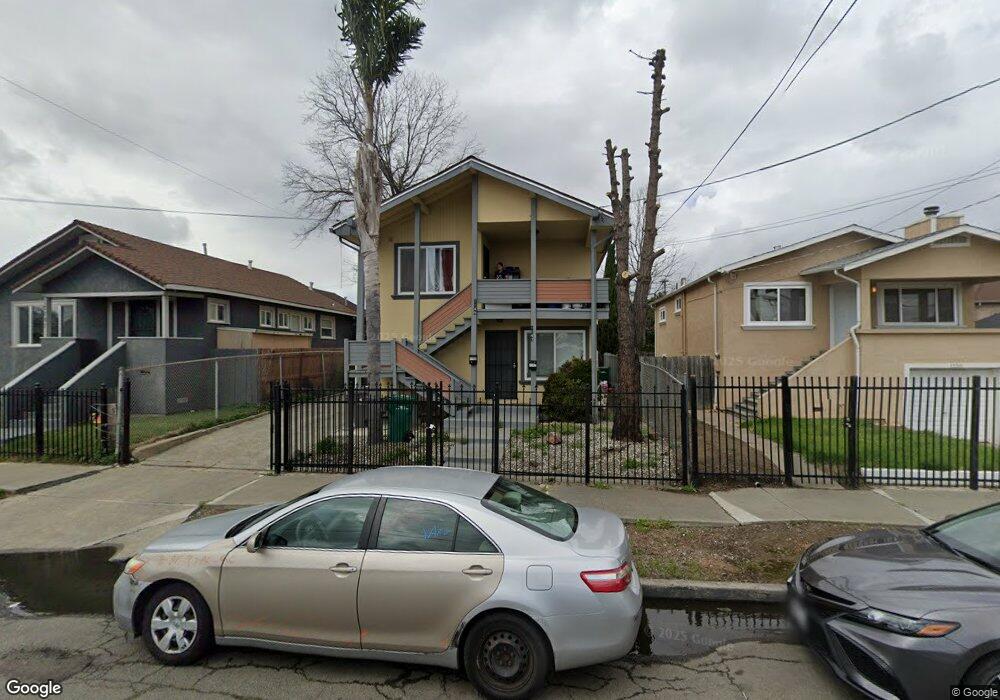
1149 91st Ave Oakland, CA 94603
Highland NeighborhoodEstimated Value: $523,000 - $653,000
4
Beds
2
Baths
1,441
Sq Ft
$390/Sq Ft
Est. Value
About This Home
This home is located at 1149 91st Ave, Oakland, CA 94603 and is currently estimated at $561,987, approximately $389 per square foot. 1149 91st Ave is a home located in Alameda County with nearby schools including New Highland Academy, Acorn Woodland Elementary School, and Encompass Academy Elementary.
Ownership History
Date
Name
Owned For
Owner Type
Purchase Details
Closed on
Jun 26, 2023
Sold by
Jesus Frank and Jesus Odilia S
Bought by
Frank A Jesus And Odilia S Jesus Declaration and Jesus
Current Estimated Value
Purchase Details
Closed on
Mar 29, 2011
Sold by
Federal Home Loan Mortgage Corporation
Bought by
Jesus Frank and Jesus Odilia S
Purchase Details
Closed on
Feb 1, 2011
Sold by
Lee Wai Ming and Chan Yuk Lan
Bought by
Federal Home Loan Mortgage Corporation
Purchase Details
Closed on
Dec 27, 2005
Sold by
Mills Dawud and Estate Of Charles Bernard Barb
Bought by
Lee Wai Ming and Chan Yuk Lan
Home Financials for this Owner
Home Financials are based on the most recent Mortgage that was taken out on this home.
Original Mortgage
$336,000
Interest Rate
6.25%
Mortgage Type
Fannie Mae Freddie Mac
Create a Home Valuation Report for This Property
The Home Valuation Report is an in-depth analysis detailing your home's value as well as a comparison with similar homes in the area
Home Values in the Area
Average Home Value in this Area
Purchase History
| Date | Buyer | Sale Price | Title Company |
|---|---|---|---|
| Frank A Jesus And Odilia S Jesus Declaration | -- | None Listed On Document | |
| Jesus Frank | $125,500 | Lsi Title Company | |
| Federal Home Loan Mortgage Corporation | $266,339 | Accommodation | |
| Lee Wai Ming | $480,000 | Chicago Title Co |
Source: Public Records
Mortgage History
| Date | Status | Borrower | Loan Amount |
|---|---|---|---|
| Previous Owner | Lee Wai Ming | $336,000 |
Source: Public Records
Tax History Compared to Growth
Tax History
| Year | Tax Paid | Tax Assessment Tax Assessment Total Assessment is a certain percentage of the fair market value that is determined by local assessors to be the total taxable value of land and additions on the property. | Land | Improvement |
|---|---|---|---|---|
| 2025 | $4,342 | $160,777 | $48,169 | $112,608 |
| 2024 | $4,342 | $157,626 | $47,225 | $110,401 |
| 2023 | $4,407 | $154,536 | $46,299 | $108,237 |
| 2022 | $4,153 | $151,506 | $45,391 | $106,115 |
| 2021 | $3,765 | $148,535 | $44,501 | $104,034 |
| 2020 | $3,720 | $147,013 | $44,045 | $102,968 |
| 2019 | $3,448 | $144,132 | $43,182 | $100,950 |
| 2018 | $3,380 | $141,307 | $42,336 | $98,971 |
| 2017 | $3,199 | $138,537 | $41,506 | $97,031 |
| 2016 | $3,017 | $135,821 | $40,692 | $95,129 |
| 2015 | $2,996 | $133,782 | $40,081 | $93,701 |
| 2014 | $3,018 | $131,162 | $39,296 | $91,866 |
Source: Public Records
Map
Nearby Homes