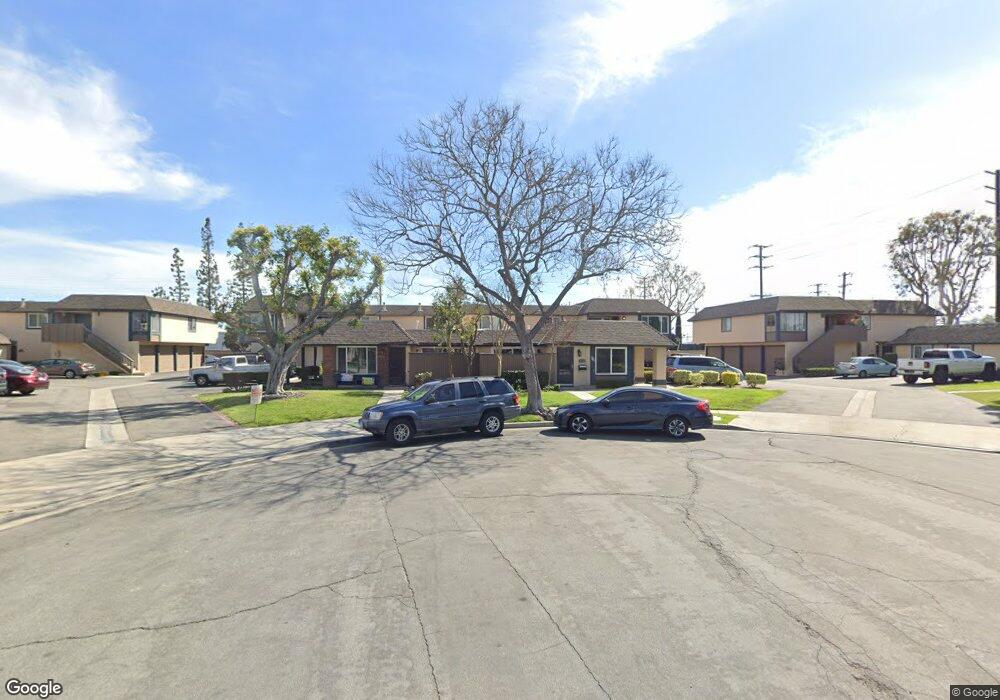
1149 S Clifpark Cir Unit 17N Anaheim, CA 92805
Southeast Anaheim NeighborhoodEstimated Value: $608,498 - $632,000
3
Beds
2
Baths
1,118
Sq Ft
$554/Sq Ft
Est. Value
About This Home
This home is located at 1149 S Clifpark Cir Unit 17N, Anaheim, CA 92805 and is currently estimated at $618,875, approximately $553 per square foot. 1149 S Clifpark Cir Unit 17N is a home located in Orange County with nearby schools including Theodore Roosevelt Elementary School, South Junior High School, and Katella High School.
Ownership History
Date
Name
Owned For
Owner Type
Purchase Details
Closed on
Dec 16, 2010
Sold by
Mcfaul Nancy J
Bought by
Ace Asset Leasing Llc
Current Estimated Value
Purchase Details
Closed on
Oct 8, 2002
Sold by
Perry Jenelle K
Bought by
Mcfaul Kathryn T
Purchase Details
Closed on
Jun 26, 2001
Sold by
Vujkovic Zdravko G and Vujkovic Irene
Bought by
Perry Jenelle K
Home Financials for this Owner
Home Financials are based on the most recent Mortgage that was taken out on this home.
Original Mortgage
$169,750
Interest Rate
7.14%
Mortgage Type
FHA
Purchase Details
Closed on
Apr 14, 2000
Sold by
Larue Norma M
Bought by
Vujkovic Zdravko G and Vujkovic Irene
Home Financials for this Owner
Home Financials are based on the most recent Mortgage that was taken out on this home.
Original Mortgage
$140,381
Interest Rate
8.25%
Mortgage Type
FHA
Create a Home Valuation Report for This Property
The Home Valuation Report is an in-depth analysis detailing your home's value as well as a comparison with similar homes in the area
Home Values in the Area
Average Home Value in this Area
Purchase History
| Date | Buyer | Sale Price | Title Company |
|---|---|---|---|
| Ace Asset Leasing Llc | $250,000 | Lawyers Title | |
| Mcfaul Kathryn T | $234,500 | -- | |
| Perry Jenelle K | $175,000 | Commonwealth Land Title | |
| Vujkovic Zdravko G | $144,500 | North American Title Co |
Source: Public Records
Mortgage History
| Date | Status | Borrower | Loan Amount |
|---|---|---|---|
| Previous Owner | Perry Jenelle K | $169,750 | |
| Previous Owner | Vujkovic Zdravko G | $140,381 |
Source: Public Records
Tax History Compared to Growth
Tax History
| Year | Tax Paid | Tax Assessment Tax Assessment Total Assessment is a certain percentage of the fair market value that is determined by local assessors to be the total taxable value of land and additions on the property. | Land | Improvement |
|---|---|---|---|---|
| 2025 | $3,837 | $320,289 | $239,680 | $80,609 |
| 2024 | $3,837 | $314,009 | $234,980 | $79,029 |
| 2023 | $3,755 | $307,852 | $230,372 | $77,480 |
| 2022 | $3,706 | $301,816 | $225,855 | $75,961 |
| 2021 | $3,711 | $295,899 | $221,427 | $74,472 |
| 2020 | $3,695 | $292,865 | $219,156 | $73,709 |
| 2019 | $3,588 | $287,123 | $214,859 | $72,264 |
| 2018 | $3,515 | $281,494 | $210,646 | $70,848 |
| 2017 | $3,380 | $275,975 | $206,516 | $69,459 |
| 2016 | $3,369 | $270,564 | $202,466 | $68,098 |
| 2015 | $3,339 | $266,500 | $199,424 | $67,076 |
| 2014 | $3,138 | $261,280 | $195,517 | $65,763 |
Source: Public Records
Map
Nearby Homes
- 1101 S Clifpark Cir
- 2144 E Almont Ave
- 617 E Eton Place
- 611 E Eton Place
- 1415 E South St
- 1615 E South St
- 725 S Mosaic St
- 760 S Olive St
- 1206 W Cara Dr
- 1539 W Cara Dr
- 1638 S Urbana St
- 1422 S Urbana St
- 651 E Valencia St
- 1020 S Cambridge St
- 1403 W Bushell St
- 1407 W Bushell St
- 842 S Anaheim Blvd
- 1522 S Urbana St
- 1414 S Urbana St
- 1415 W Cara Dr
- 1147 S Clifpark Cir Unit 16
- 1145 S Clifpark Cir Unit 15
- 1148 S Clifpark Cir Unit 21R
- 1143 S Clifpark Cir Unit 14
- 1150 S Clifpark Cir Unit 20Q
- 1150 S Clifpark Cir
- 1152 S Clifpark Cir Unit 19p
- 1152 S Clifpark Cir
- 1154 S Clifpark Cir Unit 18
- 1141 S Clifpark Cir Unit 13
- 1146 S Clifpark Cir
- 1139 S Clifpark Cir Unit 12E
- 1143 S Dover Cir Unit 27
- 1144 S Clifpark Cir
- 1140 S Clifpark Cir
- 1137 S Clifpark Cir Unit 11D
- 1142 S Clifpark Cir Unit 24M
- 1142 S Clifpark Cir
- 1145 S Dover Cir Unit 28Q
- 1145 S Dover Cir