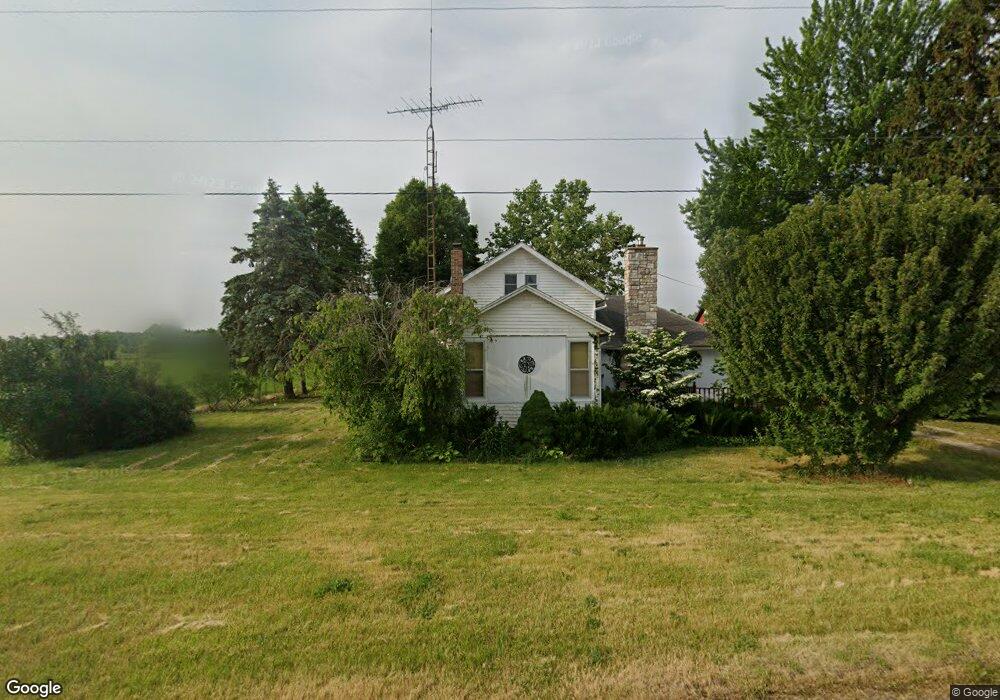
11490 Pierce Rd Wakarusa, IN 46573
Estimated Value: $351,192 - $385,000
3
Beds
1
Bath
1,766
Sq Ft
$208/Sq Ft
Est. Value
About This Home
This home is located at 11490 Pierce Rd, Wakarusa, IN 46573 and is currently estimated at $368,096, approximately $208 per square foot. 11490 Pierce Rd is a home located in St. Joseph County with nearby schools including J.C. Hoglan Elementary School, Madison Elementary School, and Virgil I. Grissom Middle School.
Ownership History
Date
Name
Owned For
Owner Type
Purchase Details
Closed on
Jan 16, 2019
Sold by
Neer David T
Bought by
Yoder Carl D
Current Estimated Value
Purchase Details
Closed on
Dec 14, 2010
Sold by
Neer David T and Neer Joseph C
Bought by
Neer David T and Neer Joseph C
Purchase Details
Closed on
Feb 22, 2005
Sold by
Neer Dorothy E
Bought by
Neer Charles M and Neer Joseph C
Create a Home Valuation Report for This Property
The Home Valuation Report is an in-depth analysis detailing your home's value as well as a comparison with similar homes in the area
Home Values in the Area
Average Home Value in this Area
Purchase History
| Date | Buyer | Sale Price | Title Company |
|---|---|---|---|
| Yoder Carl D | -- | Metropolitan Title | |
| Neer David T | -- | None Available | |
| Neer Charles M | -- | None Available |
Source: Public Records
Tax History Compared to Growth
Tax History
| Year | Tax Paid | Tax Assessment Tax Assessment Total Assessment is a certain percentage of the fair market value that is determined by local assessors to be the total taxable value of land and additions on the property. | Land | Improvement |
|---|---|---|---|---|
| 2024 | $1,268 | $167,400 | $90,300 | $77,100 |
| 2023 | $1,225 | $163,900 | $84,100 | $79,800 |
| 2022 | $1,306 | $157,500 | $77,700 | $79,800 |
| 2021 | $1,114 | $134,400 | $61,900 | $72,500 |
| 2020 | $1,086 | $134,900 | $61,700 | $73,200 |
| 2019 | $1,160 | $139,500 | $66,300 | $73,200 |
| 2018 | $926 | $135,800 | $65,400 | $70,400 |
| 2017 | $967 | $137,000 | $69,000 | $68,000 |
| 2016 | $1,019 | $138,900 | $70,700 | $68,200 |
| 2014 | $1,125 | $142,900 | $73,300 | $69,600 |
Source: Public Records
Map
Nearby Homes
- 312 E Wabash Ave
- 317 E Waterford St
- 66740 Baldwin
- 724 Elm Rd
- 16988 New Rd
- Indiana Ave County Road 1
- Lot 681A Stoneham Dr Unit 681A
- Lot 682A Stoneham Dr Unit 682A
- 107 E Dewey St
- 127 W Mill St
- 323 N Indiana St
- 61829 County Road 7
- 2960 Sycamore Ln
- 346 Wellfield Dr
- 324 Wellfield Dr Unit Lot 84
- 13550 Dragoon Trail
- 136 Tulip Cir
- 411 S Montgomery St
- 302 E Woodview Dr
- 70891 Tecumseh Dr
- 11564 Pierce Rd
- 11300 Pierce Rd
- 11777 Pierce Rd
- 11192 Pierce Rd
- 11899 Pierce Rd
- 65790 Beech Rd
- 65738 Cedar Rd
- 11399 Patterson Rd
- 65608 Cedar Rd
- 65595 Beech Rd
- 66261 Cedar Rd
- 10899 Pierce Rd
- 65523 Beech Rd
- 12351 Pierce Rd
- 66491 Beech Rd
- 11233 Patterson Rd
- 11595 Patterson Rd
- 65811 Cedar Rd
- 11151 Patterson Rd
- 65657 Beech Rd