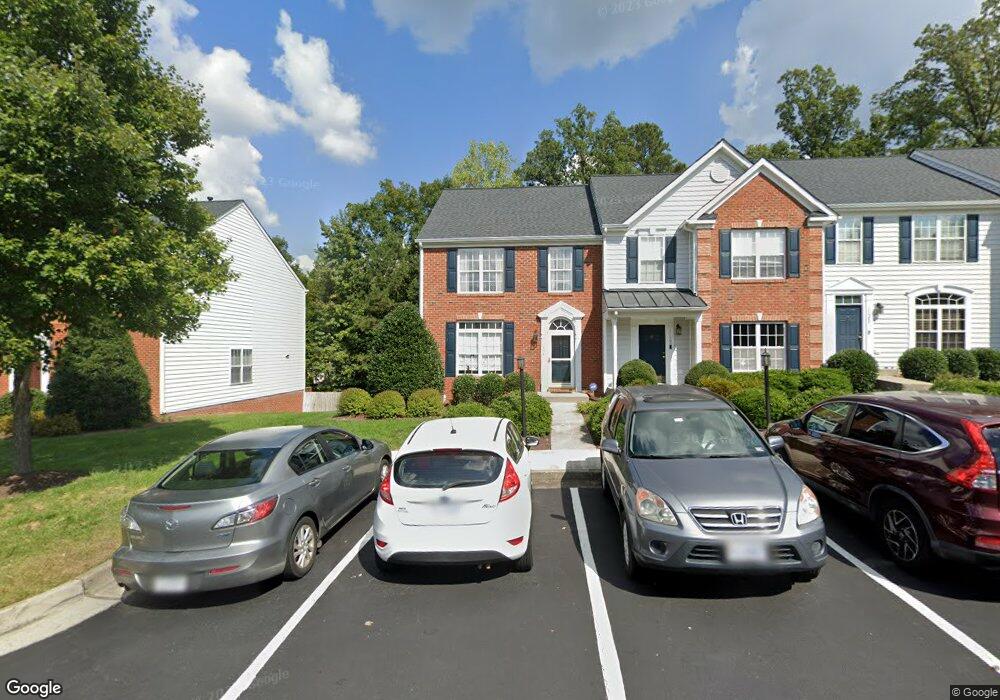
11498 Abbots Cross Ln Unit 11498 Glen Allen, VA 23059
Echo Lake NeighborhoodEstimated Value: $393,000 - $430,000
3
Beds
4
Baths
2,388
Sq Ft
$172/Sq Ft
Est. Value
About This Home
This home is located at 11498 Abbots Cross Ln Unit 11498, Glen Allen, VA 23059 and is currently estimated at $410,502, approximately $171 per square foot. 11498 Abbots Cross Ln Unit 11498 is a home located in Henrico County with nearby schools including Glen Allen Elementary School, Hungary Creek Middle School, and Glen Allen High School.
Ownership History
Date
Name
Owned For
Owner Type
Purchase Details
Closed on
Mar 7, 2016
Sold by
Hughes Family Llc A Virginia Limited Lia
Bought by
Leshin Brian A and Leshin Lindsay E
Current Estimated Value
Home Financials for this Owner
Home Financials are based on the most recent Mortgage that was taken out on this home.
Original Mortgage
$203,575
Outstanding Balance
$161,874
Interest Rate
3.79%
Mortgage Type
New Conventional
Estimated Equity
$248,628
Purchase Details
Closed on
Oct 29, 2015
Sold by
Mcnamara Abby Hughes
Bought by
Hughes Family Llc A Virginia Limited Lia
Purchase Details
Closed on
May 25, 2011
Sold by
Wilson Brian T
Bought by
Hughes Abby M
Home Financials for this Owner
Home Financials are based on the most recent Mortgage that was taken out on this home.
Original Mortgage
$145,000
Interest Rate
4.85%
Mortgage Type
New Conventional
Create a Home Valuation Report for This Property
The Home Valuation Report is an in-depth analysis detailing your home's value as well as a comparison with similar homes in the area
Home Values in the Area
Average Home Value in this Area
Purchase History
| Date | Buyer | Sale Price | Title Company |
|---|---|---|---|
| Leshin Brian A | $239,500 | Attorney | |
| Hughes Family Llc A Virginia Limited Lia | $255,000 | Attorney | |
| Hughes Abby M | $207,000 | -- |
Source: Public Records
Mortgage History
| Date | Status | Borrower | Loan Amount |
|---|---|---|---|
| Open | Leshin Brian A | $203,575 | |
| Previous Owner | Hughes Abby M | $145,000 |
Source: Public Records
Tax History Compared to Growth
Tax History
| Year | Tax Paid | Tax Assessment Tax Assessment Total Assessment is a certain percentage of the fair market value that is determined by local assessors to be the total taxable value of land and additions on the property. | Land | Improvement |
|---|---|---|---|---|
| 2025 | $3,094 | $365,300 | $77,000 | $288,300 |
| 2024 | $3,094 | $349,700 | $71,500 | $278,200 |
| 2023 | $2,972 | $349,700 | $71,500 | $278,200 |
| 2022 | $2,672 | $314,300 | $60,500 | $253,800 |
| 2021 | $2,429 | $275,300 | $55,000 | $220,300 |
| 2020 | $2,395 | $275,300 | $55,000 | $220,300 |
| 2019 | $2,258 | $259,500 | $55,000 | $204,500 |
| 2018 | $2,206 | $253,600 | $55,000 | $198,600 |
| 2017 | $2,085 | $239,600 | $55,000 | $184,600 |
| 2016 | $1,946 | $223,700 | $55,000 | $168,700 |
| 2015 | $1,946 | $223,700 | $55,000 | $168,700 |
| 2014 | $1,946 | $223,700 | $55,000 | $168,700 |
Source: Public Records
Map
Nearby Homes
- 11361 Abbots Cross Ln
- 111 Siena Ln
- 2915 Murano Way
- 3948 Mountain Rd
- 3805 Mill Pine Ct
- 11572 Chapman Mill Dr
- 11416 Creery Rd
- 3904 Links Ln
- 3908 Lyons Mill Ln
- 11213 Carrington Green Dr
- 3916 Lyons Mill Ln
- JAMESTOWN Plan at Sheppard Mill
- Hampton Plan at Sheppard Mill
- SUMMIT Plan at Sheppard Mill
- WESTERLY Plan at Sheppard Mill
- VANDERBILT Plan at Sheppard Mill
- 11601 Sethwarner Dr
- 5929 Moriano Terrace
- 9104 Rigney Terrace
- 11089 Summer Breeze Dr
- 11498 Abbots Cross Ln
- 11498 Abbots Cross Ln
- 11500 Abbots Cross Ln
- 11500 Abbots Cross Ln Unit 11500
- 11502 Abbots Cross Ln
- 11502 Abbots Cross Ln Unit n/a
- 11496 Abbots Cross Ln
- 11496 Abbots Cross Ln Unit END
- 11504 Abbots Cross Ln
- 11504 Abbots Cross Ln Unit .
- 11494 Abbots Cross Ln
- 11494 Abbots Cross Ln Unit N/A
- 11492 Abbots Cross Ln
- 11490 Abbots Cross Ln
- 11501 Abbots Cross Ln
- 11499 Abbots Cross Ln
- 11505 Abbots Cross Ln
- 11505 Abbots Cross Ln Unit none
- 11497 Abbots Cross Ln
- 11497 Abbots Cross Ln