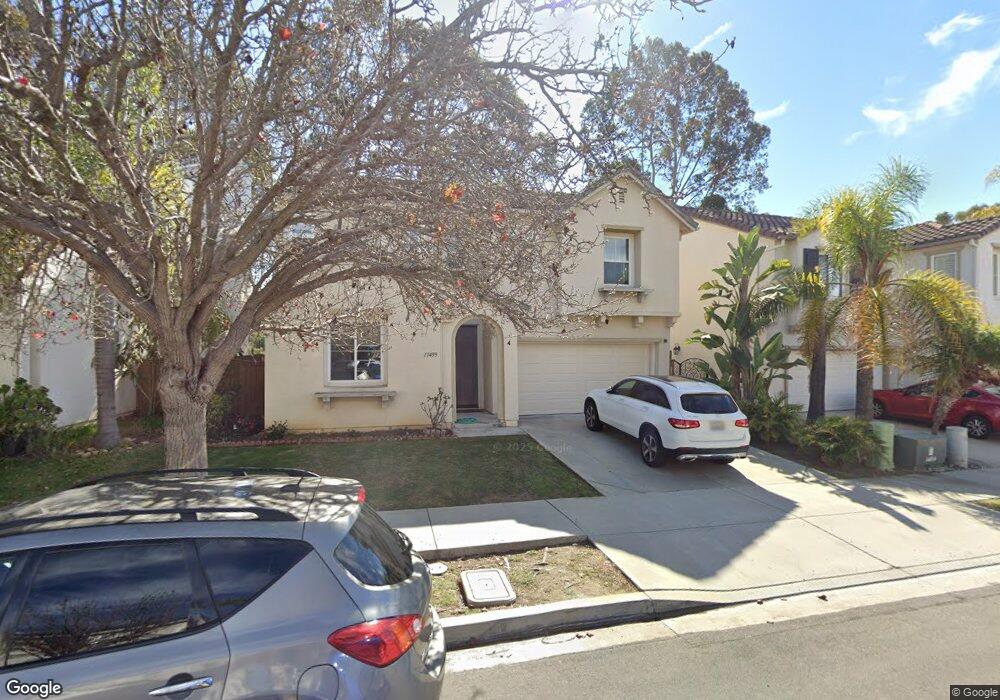
11499 Trailbrook Ln Unit 2 San Diego, CA 92128
Estimated Value: $1,352,555 - $1,504,000
3
Beds
3
Baths
2,092
Sq Ft
$687/Sq Ft
Est. Value
About This Home
This home is located at 11499 Trailbrook Ln Unit 2, San Diego, CA 92128 and is currently estimated at $1,436,639, approximately $686 per square foot. 11499 Trailbrook Ln Unit 2 is a home located in San Diego County with nearby schools including Creekside Elementary, Meadowbrook Middle, and Mt. Carmel High School.
Ownership History
Date
Name
Owned For
Owner Type
Purchase Details
Closed on
Feb 4, 2014
Sold by
Pu Zhengcai and Sun Xinyan
Bought by
Pu Zhengcai and Sun Xinyan
Current Estimated Value
Home Financials for this Owner
Home Financials are based on the most recent Mortgage that was taken out on this home.
Original Mortgage
$498,000
Outstanding Balance
$378,077
Interest Rate
4.46%
Mortgage Type
New Conventional
Estimated Equity
$1,058,562
Purchase Details
Closed on
Aug 12, 2008
Sold by
Pu Zhengcai
Bought by
Pu Zhengcai and Sun Xinyan
Purchase Details
Closed on
Mar 17, 2006
Sold by
Pu Zhengcai and He Jianjun
Bought by
Pu Zhengcai
Purchase Details
Closed on
May 3, 2002
Sold by
Pardee Homes
Bought by
Pu Zhengcai and He Jianjun
Home Financials for this Owner
Home Financials are based on the most recent Mortgage that was taken out on this home.
Original Mortgage
$361,640
Interest Rate
6.83%
Create a Home Valuation Report for This Property
The Home Valuation Report is an in-depth analysis detailing your home's value as well as a comparison with similar homes in the area
Home Values in the Area
Average Home Value in this Area
Purchase History
| Date | Buyer | Sale Price | Title Company |
|---|---|---|---|
| Pu Zhengcai | -- | Old Republic Title Company | |
| Pu Zhengcai | -- | None Available | |
| Pu Zhengcai | -- | None Available | |
| Pu Zhengcai | $452,500 | First American Title |
Source: Public Records
Mortgage History
| Date | Status | Borrower | Loan Amount |
|---|---|---|---|
| Open | Pu Zhengcai | $498,000 | |
| Closed | Pu Zhengcai | $361,640 | |
| Closed | Pu Zhengcai | $67,807 |
Source: Public Records
Tax History Compared to Growth
Tax History
| Year | Tax Paid | Tax Assessment Tax Assessment Total Assessment is a certain percentage of the fair market value that is determined by local assessors to be the total taxable value of land and additions on the property. | Land | Improvement |
|---|---|---|---|---|
| 2025 | $6,944 | $667,790 | $324,992 | $342,798 |
| 2024 | $6,944 | $654,697 | $318,620 | $336,077 |
| 2023 | $6,792 | $641,861 | $312,373 | $329,488 |
| 2022 | $6,688 | $629,277 | $306,249 | $323,028 |
| 2021 | $6,563 | $616,940 | $300,245 | $316,695 |
| 2020 | $6,493 | $610,615 | $297,167 | $313,448 |
| 2019 | $7,143 | $598,643 | $291,341 | $307,302 |
| 2018 | $6,951 | $586,906 | $285,629 | $301,277 |
| 2017 | $6,812 | $575,399 | $280,029 | $295,370 |
| 2016 | $6,689 | $564,118 | $274,539 | $289,579 |
| 2015 | $6,600 | $555,646 | $270,416 | $285,230 |
| 2014 | $6,503 | $544,762 | $265,119 | $279,643 |
Source: Public Records
Map
Nearby Homes
- 11553 Trailbrook Ln Unit 2
- 11590 Trailbrook Ln
- 12676 Springbrook Dr Unit B
- 12662 Springbrook Dr Unit D
- 12670 Springbrook Dr Unit D
- 12626 Springbrook Dr Unit A
- 12530 Heatherton Ct Unit 31
- 12490 Heatherton Ct Unit 8
- 11121 Catarina Ln Unit 73
- 12665 Creekview Dr Unit 140
- 11964 Ashley Place
- 10978 Serafina Ln Unit 69
- 0 Dorathea Terrace
- 10804 Serafina Ln Unit 6
- 10914 Ivy Hill Dr Unit 1
- 11315 Middle Ridge Terrace
- 11793 Alderhill Terrace
- 10818 Caminito Arcada
- 13034 Wimberly Square Unit 27
- 13048 Wimberly Square Unit 29
- 11507 Trailbrook Ln
- 11493 Trailbrook Ln
- 11513 Trailbrook Ln
- 11487 Trailbrook Ln Unit 2
- 11498 Trailbrook Ln Unit 2
- 11521 Trailbrook Ln Unit 2
- 11475 Trailbrook Ln
- 11504 Trailbrook Ln
- 11494 Trailbrook Ln Unit 2
- 11512 Trailbrook Ln
- 11488 Trailbrook Ln Unit 2
- 11518 Trailbrook Ln
- 11527 Trailbrook Ln Unit 2
- 11469 Trailbrook Ln
- 11482 Trailbrook Ln
- 11501 Creekstone Ln
- 11507 Creekstone Ln
- 11495 Creekstone Ln
- 11524 Trailbrook Ln
- 11513 Creekstone Ln