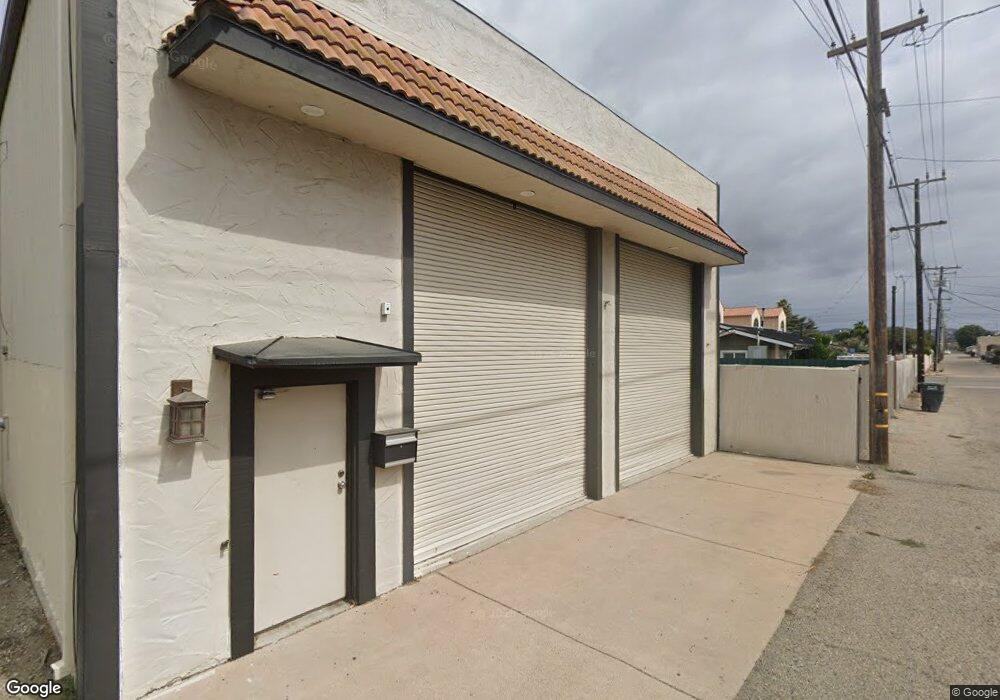
115 1/2 N F St Lompoc, CA 93436
Estimated Value: $313,104
--
Bed
--
Bath
1,580
Sq Ft
$198/Sq Ft
Est. Value
About This Home
This home is located at 115 1/2 N F St, Lompoc, CA 93436 and is currently estimated at $313,104, approximately $198 per square foot. 115 1/2 N F St is a home located in Santa Barbara County with nearby schools including Arthur Hapgood Elementary School, Lompoc Valley Middle School, and Lompoc High School.
Ownership History
Date
Name
Owned For
Owner Type
Purchase Details
Closed on
Dec 8, 2020
Sold by
Margo Victor
Bought by
Vangenderen Monique
Current Estimated Value
Home Financials for this Owner
Home Financials are based on the most recent Mortgage that was taken out on this home.
Original Mortgage
$132,500
Outstanding Balance
$118,175
Interest Rate
2.8%
Mortgage Type
New Conventional
Estimated Equity
$194,929
Purchase Details
Closed on
Aug 10, 2020
Sold by
Shahrouzi Shahram
Bought by
Vangenderen Monique
Home Financials for this Owner
Home Financials are based on the most recent Mortgage that was taken out on this home.
Original Mortgage
$106,000
Interest Rate
2.8%
Mortgage Type
Commercial
Purchase Details
Closed on
Feb 14, 2008
Sold by
Ledesma Trini and Morris Carol
Bought by
Shahrouzi Shahram
Purchase Details
Closed on
Apr 19, 2006
Sold by
Dyer Darlene M
Bought by
Ledesma Trini and Morris Carol
Purchase Details
Closed on
Dec 18, 2002
Sold by
Dyer Melvin
Bought by
Dyer Melvin W Bud and Dyer Darlene M
Create a Home Valuation Report for This Property
The Home Valuation Report is an in-depth analysis detailing your home's value as well as a comparison with similar homes in the area
Home Values in the Area
Average Home Value in this Area
Purchase History
| Date | Buyer | Sale Price | Title Company |
|---|---|---|---|
| Vangenderen Monique | -- | First American Title | |
| Vangenderen Monique | $231,000 | First American Title | |
| Shahrouzi Shahram | $220,000 | Chicago Title Company | |
| Ledesma Trini | $200,000 | Chicago Title Company | |
| Dyer Melvin W Bud | -- | -- |
Source: Public Records
Mortgage History
| Date | Status | Borrower | Loan Amount |
|---|---|---|---|
| Open | Vangenderen Monique | $132,500 | |
| Previous Owner | Vangenderen Monique | $106,000 | |
| Closed | Vangenderen Monique | $106,000 |
Source: Public Records
Tax History Compared to Growth
Tax History
| Year | Tax Paid | Tax Assessment Tax Assessment Total Assessment is a certain percentage of the fair market value that is determined by local assessors to be the total taxable value of land and additions on the property. | Land | Improvement |
|---|---|---|---|---|
| 2025 | $2,765 | $250,039 | $37,884 | $212,155 |
| 2023 | $2,765 | $240,332 | $36,414 | $203,918 |
| 2022 | $2,716 | $235,620 | $35,700 | $199,920 |
| 2021 | $2,744 | $231,000 | $35,000 | $196,000 |
| 2020 | $3,127 | $264,218 | $108,088 | $156,130 |
| 2019 | $3,076 | $259,038 | $105,969 | $153,069 |
| 2018 | $3,028 | $253,960 | $103,892 | $150,068 |
| 2017 | $2,973 | $248,981 | $101,855 | $147,126 |
| 2016 | $2,919 | $244,100 | $99,858 | $144,242 |
| 2014 | $2,857 | $235,726 | $96,433 | $139,293 |
Source: Public Records
Map
Nearby Homes
- 122 N G St
- 801, 851 California 246
- 220 N F St
- 224 N F St
- 315 E Chestnut Ave
- 215 S H St
- 135 N J St
- 510 N I St
- 333 S J St
- 516 N L St
- 214 S O St
- 612 University Dr
- 424 N 2nd St
- 610 E Pine Ave Unit Space 73
- 610 E Pine Ave Unit 17
- 800 Clemens Way
- 615 N 1st St
- 1200 Peach Ave
- 1210 E Walnut Ave Unit D
- 1112 E Hickory Ave
- 0 N F St
- 115 N F St
- 111 N F St
- 219 E Ocean Ave
- 126 N G St
- 133 N F St
- 130 N G St Unit A
- 130 N G St
- 4300 California 246
- 0 California 246
- 112 1weup7469ph7 F 1weup796pknd
- 0 E Hwy 246 Unit 3-2367
- 0 E Hwy 246 Unit 201957
- 0 E Hwy 246 Unit 96-3379
- 0 W Hwy 246 Unit 97-478
- 124 N F St
- 212 E Walnut Ave
- 119 E Ocean Ave
- 307-321 E Ocean Ave
- 206-210 E Ocean Ave