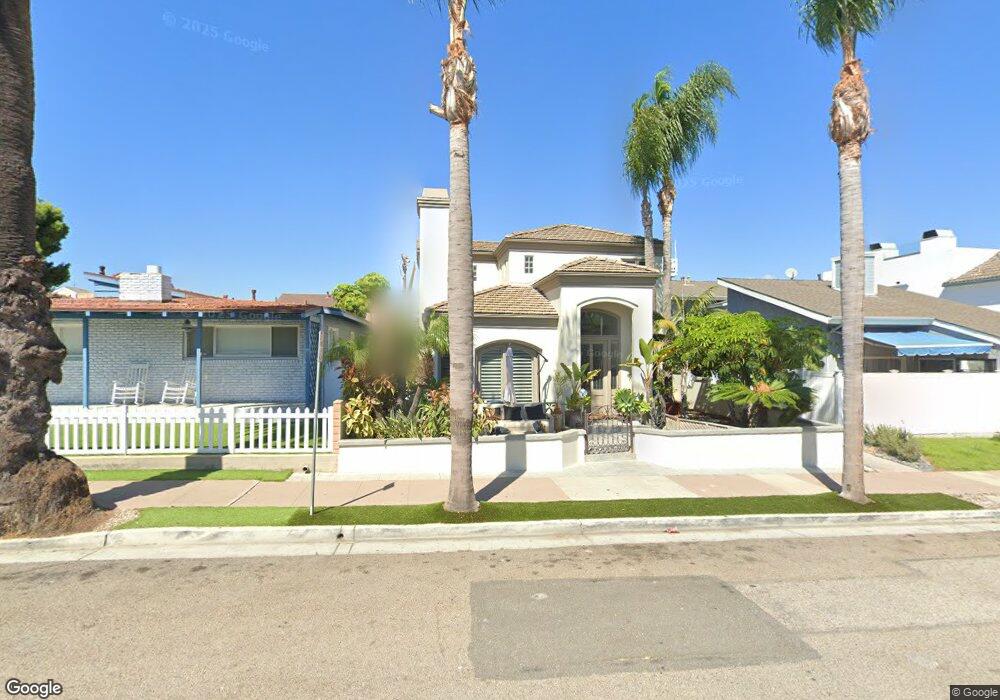
115 2nd St Seal Beach, CA 90740
Estimated Value: $2,052,000 - $2,871,504
3
Beds
3
Baths
3,369
Sq Ft
$780/Sq Ft
Est. Value
About This Home
This home is located at 115 2nd St, Seal Beach, CA 90740 and is currently estimated at $2,628,876, approximately $780 per square foot. 115 2nd St is a home located in Orange County with nearby schools including J. H. Mcgaugh Elementary School, Jack L. Weaver Elementary School, and Sharon Christa Mcauliffe Middle School.
Ownership History
Date
Name
Owned For
Owner Type
Purchase Details
Closed on
Apr 17, 2014
Sold by
Sulimoff Wesley Thomas and Sulimoff Rona I
Bought by
Sulimoff Family Trust
Current Estimated Value
Purchase Details
Closed on
Apr 17, 2007
Sold by
Sulimoff Wesley Thomas and Sulimoff Rona I
Bought by
Sulimoff Wesley T and Sulimoff Rona I
Purchase Details
Closed on
Mar 19, 1999
Sold by
Thomas Sulimoff Wesley
Bought by
Sulimoff Wesley Thomas and Sulimoff Rona I
Home Financials for this Owner
Home Financials are based on the most recent Mortgage that was taken out on this home.
Original Mortgage
$232,000
Interest Rate
6.73%
Purchase Details
Closed on
Jan 13, 1995
Sold by
Aramburu Maria J
Bought by
Sulimoff Wesley Thomas
Create a Home Valuation Report for This Property
The Home Valuation Report is an in-depth analysis detailing your home's value as well as a comparison with similar homes in the area
Home Values in the Area
Average Home Value in this Area
Purchase History
| Date | Buyer | Sale Price | Title Company |
|---|---|---|---|
| Sulimoff Family Trust | -- | None Available | |
| Sulimoff Wesley T | -- | None Available | |
| Sulimoff Wesley Thomas | -- | American Title Co | |
| Sullmoff Wesley Thomas | -- | American Title Co | |
| Sulimoff Wesley Thomas | -- | Commonwealth Land Title |
Source: Public Records
Mortgage History
| Date | Status | Borrower | Loan Amount |
|---|---|---|---|
| Closed | Sullmoff Wesley Thomas | $232,000 |
Source: Public Records
Tax History
| Year | Tax Paid | Tax Assessment Tax Assessment Total Assessment is a certain percentage of the fair market value that is determined by local assessors to be the total taxable value of land and additions on the property. | Land | Improvement |
|---|---|---|---|---|
| 2025 | $13,227 | $1,166,009 | $650,055 | $515,954 |
| 2024 | $13,227 | $1,143,147 | $637,309 | $505,838 |
| 2023 | $12,933 | $1,120,733 | $624,813 | $495,920 |
| 2022 | $12,801 | $1,098,758 | $612,561 | $486,197 |
| 2021 | $12,515 | $1,077,214 | $600,550 | $476,664 |
| 2020 | $12,537 | $1,066,169 | $594,392 | $471,777 |
| 2019 | $12,148 | $1,045,264 | $582,737 | $462,527 |
| 2018 | $11,589 | $1,024,769 | $571,311 | $453,458 |
| 2017 | $11,344 | $1,004,676 | $560,109 | $444,567 |
| 2016 | $11,128 | $984,977 | $549,127 | $435,850 |
| 2015 | $10,990 | $970,182 | $540,878 | $429,304 |
| 2014 | $10,723 | $951,178 | $530,283 | $420,895 |
Source: Public Records
Map
Nearby Homes
- 10 Ocean Place
- 208 Ocean Place
- 112 114 4th St
- 315 Spinnaker Way
- 123 Cottonwood Ln
- 100 Electric Ave
- 84 Riversea Rd
- 85 Riversea Rd
- 30 Welcome Ln
- 48 Riversea Rd
- 6911 E Ocean Blvd
- 320 7th St
- 1003 Seal Way
- 10 66th Place
- 83 63rd Place
- 1301 Electric Ave
- 11 Vista Del Golfo
- 129 14th St
- 1230 Crystal Cove Way
- 1400 Ocean Ave
Your Personal Tour Guide
Ask me questions while you tour the home.