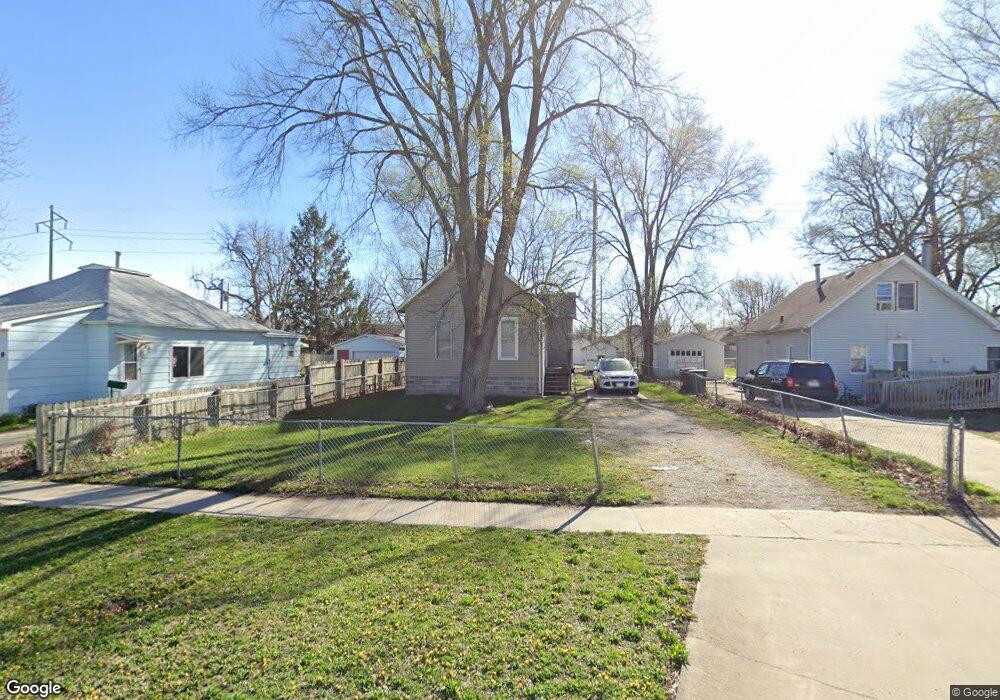
115 2nd St West Des Moines, IA 50265
Estimated Value: $148,000 - $183,000
2
Beds
1
Bath
916
Sq Ft
$180/Sq Ft
Est. Value
About This Home
This home is located at 115 2nd St, West Des Moines, IA 50265 and is currently estimated at $164,540, approximately $179 per square foot. 115 2nd St is a home located in Polk County with nearby schools including Hillside Elementary School, Stilwell Junior High School, and Valley Southwoods Freshman High School.
Ownership History
Date
Name
Owned For
Owner Type
Purchase Details
Closed on
Feb 12, 2025
Sold by
Murillo Miguel Da and Murillo Sonja V
Bought by
Hall Loretta J
Current Estimated Value
Purchase Details
Closed on
Apr 1, 2019
Sold by
Hall Stormy and Gleeson Sean M
Bought by
Estate Of Miguel Murillo Jr
Purchase Details
Closed on
Aug 24, 2009
Sold by
Shineflew Mary K
Bought by
Hall Stormy Lake
Purchase Details
Closed on
Jan 1, 1997
Sold by
Murillo Miguel
Bought by
Campbell Loretta Hall and Hall Zackary
Create a Home Valuation Report for This Property
The Home Valuation Report is an in-depth analysis detailing your home's value as well as a comparison with similar homes in the area
Home Values in the Area
Average Home Value in this Area
Purchase History
| Date | Buyer | Sale Price | Title Company |
|---|---|---|---|
| Hall Loretta J | -- | None Listed On Document | |
| Estate Of Miguel Murillo Jr | -- | None Available | |
| Hall Stormy Lake | -- | None Available | |
| Campbell Loretta Hall | -- | -- | |
| Murillo Miguel A | -- | -- |
Source: Public Records
Tax History Compared to Growth
Tax History
| Year | Tax Paid | Tax Assessment Tax Assessment Total Assessment is a certain percentage of the fair market value that is determined by local assessors to be the total taxable value of land and additions on the property. | Land | Improvement |
|---|---|---|---|---|
| 2025 | $2,066 | $139,100 | $45,600 | $93,500 |
| 2024 | $2,066 | $130,400 | $42,300 | $88,100 |
| 2023 | $2,008 | $130,400 | $42,300 | $88,100 |
| 2022 | $1,984 | $104,000 | $34,000 | $70,000 |
| 2021 | $1,892 | $104,000 | $34,000 | $70,000 |
| 2020 | $1,862 | $94,300 | $30,700 | $63,600 |
| 2019 | $1,742 | $94,300 | $30,700 | $63,600 |
| 2018 | $1,746 | $85,000 | $27,200 | $57,800 |
| 2017 | $1,700 | $85,000 | $27,200 | $57,800 |
| 2016 | $1,662 | $80,400 | $25,400 | $55,000 |
| 2015 | $1,662 | $80,400 | $25,400 | $55,000 |
| 2014 | $1,630 | $77,900 | $24,100 | $53,800 |
Source: Public Records
Map
Nearby Homes