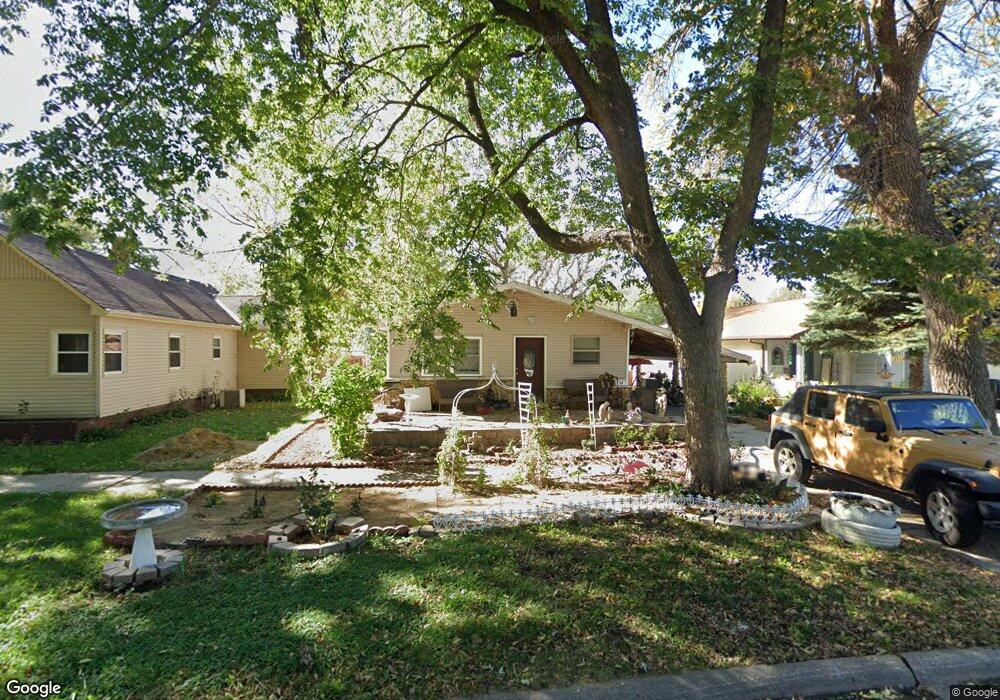
115 3rd Ave SW Le Mars, IA 51031
Estimated Value: $160,000 - $193,741
3
Beds
2
Baths
1,062
Sq Ft
$166/Sq Ft
Est. Value
About This Home
This home is located at 115 3rd Ave SW, Le Mars, IA 51031 and is currently estimated at $176,185, approximately $165 per square foot. 115 3rd Ave SW is a home located in Plymouth County with nearby schools including Le Mars High School, Gehlen Catholic Schools, and Gehlen Elementary School.
Ownership History
Date
Name
Owned For
Owner Type
Purchase Details
Closed on
Feb 15, 2024
Sold by
Pena Rafael and Pena Selena
Bought by
Foley Wendy M
Current Estimated Value
Home Financials for this Owner
Home Financials are based on the most recent Mortgage that was taken out on this home.
Original Mortgage
$120,000
Outstanding Balance
$117,770
Interest Rate
6.63%
Mortgage Type
New Conventional
Estimated Equity
$58,415
Purchase Details
Closed on
May 29, 2015
Sold by
Mullally Nicholas T and Mullally Lougemly Sales
Bought by
Pena Rafael and Pena Selena
Home Financials for this Owner
Home Financials are based on the most recent Mortgage that was taken out on this home.
Original Mortgage
$78,347
Interest Rate
3.64%
Mortgage Type
FHA
Purchase Details
Closed on
Apr 1, 2014
Sold by
Campbell Robert J and Campbell Debra R
Bought by
Mullally Nicholas T and Mullally Lougemly Sales
Purchase Details
Closed on
Sep 18, 2013
Sold by
Treasurer Plymouth County
Bought by
R & L 103 Partnership
Create a Home Valuation Report for This Property
The Home Valuation Report is an in-depth analysis detailing your home's value as well as a comparison with similar homes in the area
Home Values in the Area
Average Home Value in this Area
Purchase History
We collect this data history from publicly available records. To have your information removed, we recommend requesting removal directly through your county’s website.
| Date | Buyer | Sale Price | Title Company |
|---|---|---|---|
| Foley Wendy M | $150,000 | None Listed On Document | |
| Foley Wendy M | $150,000 | None Listed On Document | |
| Pena Rafael | $83,000 | None Available | |
| Mullally Nicholas T | $17,000 | None Available | |
| R & L 103 Partnership | -- | None Available |
Source: Public Records
Mortgage History
We collect this data history from publicly available records. To have your information removed, we recommend requesting removal directly through your county’s website.
| Date | Status | Borrower | Loan Amount |
|---|---|---|---|
| Open | Foley Wendy M | $120,000 | |
| Closed | Foley Wendy M | $120,000 | |
| Previous Owner | Pena Rafael | $78,347 |
Source: Public Records
Tax History
| Year | Tax Paid | Tax Assessment Tax Assessment Total Assessment is a certain percentage of the fair market value that is determined by local assessors to be the total taxable value of land and additions on the property. | Land | Improvement |
|---|---|---|---|---|
| 2025 | $1,784 | $157,470 | $18,000 | $139,470 |
| 2024 | $1,710 | $141,310 | $18,000 | $123,310 |
| 2023 | $1,610 | $144,200 | $16,500 | $127,700 |
| 2022 | $1,592 | $117,640 | $16,500 | $101,140 |
| 2021 | $1,546 | $117,640 | $16,500 | $101,140 |
| 2020 | $1,546 | $109,140 | $16,500 | $92,640 |
Source: Public Records
Map
Nearby Homes
- 103 3rd Ave SW Unit 1
- 139 6th Ave SW
- 401 3rd Ave SW Unit 4
- 610 4th St SW
- 415 7th St SW
- 520 1st Ave SE
- 309 1st St SE
- 334 3rd Ave SE
- 603 2nd Ave SE Unit 2
- 200 4th Ave SE
- 400 Plymouth St SE
- 414 Plymouth St SE
- 125 9th St SW
- 433 2nd Ave NE
- 909 Central Ave SW
- 114 6th Ave SE
- 135 6th Ave NE
- 1009 1st Ave SE
- 160 6th Ave NE
- 435 N Lynn Dr
- 111 3rd Ave SW
- 121 3rd Ave SW
- 109 3rd Ave SW
- 103 3rd Ave SW
- 127 3rd Ave SW
- 310 1st St SW
- 320 1st St SW Unit 3
- 320 1st St SW
- 330 1st St SW
- 120 4th Ave SW
- 135 3rd Ave SW
- 309 2nd St SW
- 126 4th Ave SW
- 100 3rd Ave SW
- 102 4th Ave SW Unit 1335
- 120 3rd Ave SW
- 114 4th Ave SW
- 114 3rd Ave SW
- 122 3rd Ave SW
- 126 3rd Ave SW
Your Personal Tour Guide
Ask me questions while you tour the home.