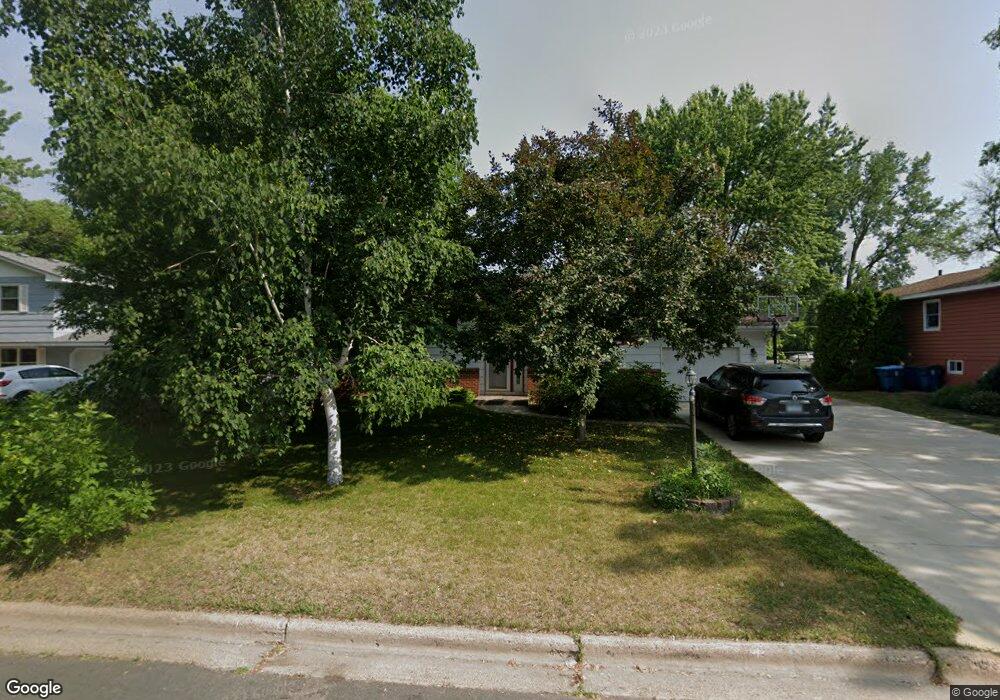
115 8th Ave NE Forest Lake, MN 55025
Estimated Value: $318,000 - $327,000
5
Beds
2
Baths
2,268
Sq Ft
$142/Sq Ft
Est. Value
About This Home
This home is located at 115 8th Ave NE, Forest Lake, MN 55025 and is currently estimated at $321,605, approximately $141 per square foot. 115 8th Ave NE is a home located in Washington County with nearby schools including Forest Lake Elementary School, Forest Lake Area Middle School, and Forest Lake Area High School.
Ownership History
Date
Name
Owned For
Owner Type
Purchase Details
Closed on
Oct 10, 2019
Sold by
Hawkins Douglas G and Hawkins Jodi L
Bought by
Wessberg Chris and Nelson Clayton W
Current Estimated Value
Home Financials for this Owner
Home Financials are based on the most recent Mortgage that was taken out on this home.
Original Mortgage
$203,000
Outstanding Balance
$177,472
Interest Rate
3.4%
Mortgage Type
New Conventional
Estimated Equity
$144,133
Purchase Details
Closed on
Feb 10, 2017
Sold by
Welsch Delise and Welsch John
Bought by
Hawkins Jodi L and Hawkins Douglas G
Home Financials for this Owner
Home Financials are based on the most recent Mortgage that was taken out on this home.
Original Mortgage
$194,200
Interest Rate
4.12%
Mortgage Type
VA
Purchase Details
Closed on
Apr 26, 2002
Sold by
Hernandez Linda and Hernandez Leign
Bought by
Welsch John and Welsch Delisa
Create a Home Valuation Report for This Property
The Home Valuation Report is an in-depth analysis detailing your home's value as well as a comparison with similar homes in the area
Home Values in the Area
Average Home Value in this Area
Purchase History
| Date | Buyer | Sale Price | Title Company |
|---|---|---|---|
| Wessberg Chris | $210,000 | Ancona Title & Escrow | |
| Hawkins Jodi L | $188,000 | Burnet Title | |
| Welsch John | $164,900 | -- |
Source: Public Records
Mortgage History
| Date | Status | Borrower | Loan Amount |
|---|---|---|---|
| Open | Wessberg Chris | $203,000 | |
| Previous Owner | Hawkins Jodi L | $194,200 |
Source: Public Records
Tax History Compared to Growth
Tax History
| Year | Tax Paid | Tax Assessment Tax Assessment Total Assessment is a certain percentage of the fair market value that is determined by local assessors to be the total taxable value of land and additions on the property. | Land | Improvement |
|---|---|---|---|---|
| 2024 | $3,040 | $295,000 | $90,000 | $205,000 |
| 2023 | $3,040 | $280,600 | $90,000 | $190,600 |
| 2022 | $2,304 | $270,800 | $88,700 | $182,100 |
| 2021 | $2,566 | $210,700 | $69,000 | $141,700 |
| 2020 | $2,332 | $228,700 | $84,000 | $144,700 |
| 2019 | $2,164 | $207,400 | $82,000 | $125,400 |
| 2018 | $1,672 | $190,600 | $85,000 | $105,600 |
| 2017 | $1,598 | $159,900 | $60,000 | $99,900 |
| 2016 | $1,388 | $146,500 | $52,000 | $94,500 |
| 2015 | $1,304 | $108,900 | $36,500 | $72,400 |
| 2013 | -- | $96,600 | $35,600 | $61,000 |
Source: Public Records
Map
Nearby Homes
- 744 N Shore Dr
- 619 3rd St NW
- 379 3rd St NW
- 220 3rd Ave NW
- 243 2nd Ave NW
- xxxx Forest Rd N
- 6631 N Shore Trail
- 319 Lake St S
- 7 S Shore Dr
- 932 W Broadway Ave
- TBD 9th St SW
- 308 8th Ave SE
- 820 3rd St SE
- 24368 Fawn Trail
- 207 11th Ave SE
- 22672 Hayward Ave N
- 5617 220th St N
- 22620 Hayward Ave N
- 1008 Bay Dr SE
- 919 15th St SE
- 127 8th Ave NE
- 103 8th Ave NE
- 104 104 8th-Avenue-ne
- 139 8th Ave NE
- 116 8th Ave NE
- 104 8th Ave NE
- 151 8th Ave NE
- 127 Birch Dr NE
- 103 Birch Dr NE
- 163 8th Ave NE
- 152 Birch Dr NE
- 146 Birch Dr NE
- 140 Birch Dr NE
- 175 8th Ave NE
- 134 Birch Dr NE
- 104 Birch Dr NE
- 116 Birch Dr NE
- 128 Birch Dr NE
- 684 Northshore Dr
- 696 N Shore Dr