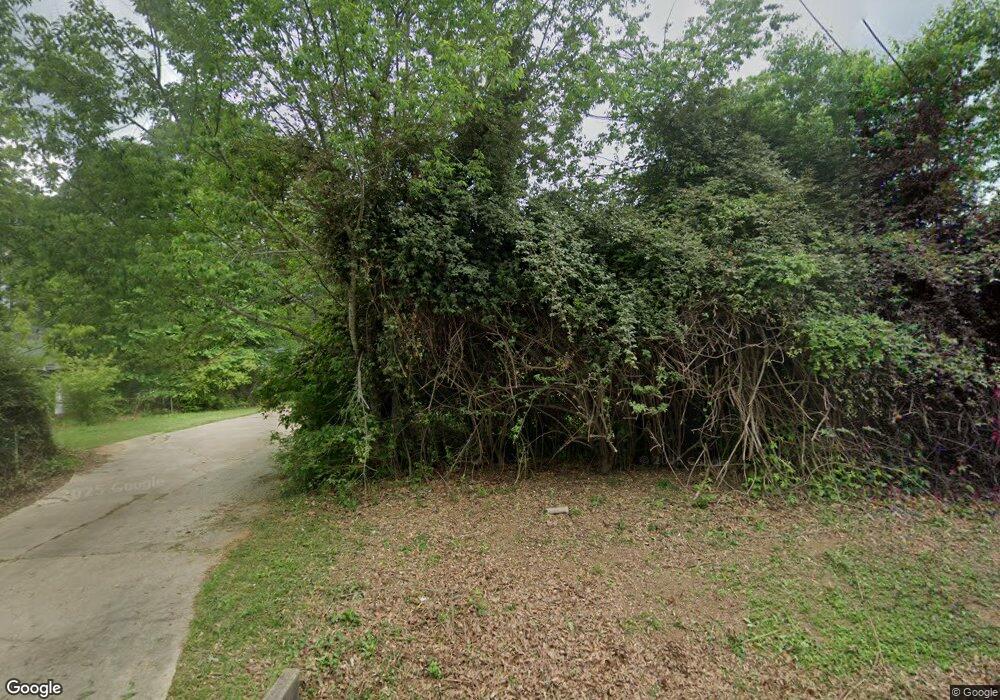
115 Arrowood Rd Unit 1 Tyrone, GA 30290
Estimated Value: $262,000 - $278,629
--
Bed
1
Bath
1,082
Sq Ft
$252/Sq Ft
Est. Value
About This Home
This home is located at 115 Arrowood Rd Unit 1, Tyrone, GA 30290 and is currently estimated at $272,407, approximately $251 per square foot. 115 Arrowood Rd Unit 1 is a home located in Fayette County with nearby schools including Crabapple Lane Elementary School, Flat Rock Middle School, and Sandy Creek High School.
Ownership History
Date
Name
Owned For
Owner Type
Purchase Details
Closed on
Mar 27, 2024
Sold by
Knott Karen Lynn and Knott Lynn
Bought by
Free David William
Current Estimated Value
Home Financials for this Owner
Home Financials are based on the most recent Mortgage that was taken out on this home.
Original Mortgage
$124,699
Outstanding Balance
$122,843
Interest Rate
6.9%
Mortgage Type
FHA
Estimated Equity
$149,564
Purchase Details
Closed on
Oct 30, 1996
Sold by
Swann Richard Dewanda
Bought by
Knott Tommy Lynn
Create a Home Valuation Report for This Property
The Home Valuation Report is an in-depth analysis detailing your home's value as well as a comparison with similar homes in the area
Home Values in the Area
Average Home Value in this Area
Purchase History
| Date | Buyer | Sale Price | Title Company |
|---|---|---|---|
| Free David William | $127,000 | None Listed On Document | |
| Knott Tommy Lynn | $89,000 | -- |
Source: Public Records
Mortgage History
| Date | Status | Borrower | Loan Amount |
|---|---|---|---|
| Open | Free David William | $124,699 | |
| Closed | Knott Tommy Lynn | $0 |
Source: Public Records
Tax History Compared to Growth
Tax History
| Year | Tax Paid | Tax Assessment Tax Assessment Total Assessment is a certain percentage of the fair market value that is determined by local assessors to be the total taxable value of land and additions on the property. | Land | Improvement |
|---|---|---|---|---|
| 2024 | $2,187 | $111,316 | $21,320 | $89,996 |
| 2023 | $1,733 | $107,000 | $21,320 | $85,680 |
| 2022 | $1,975 | $89,800 | $12,600 | $77,200 |
| 2021 | $1,690 | $65,640 | $12,600 | $53,040 |
| 2020 | $1,781 | $59,520 | $12,600 | $46,920 |
| 2019 | $1,666 | $55,320 | $12,600 | $42,720 |
| 2018 | $1,544 | $50,960 | $12,600 | $38,360 |
| 2017 | $1,481 | $48,800 | $12,600 | $36,200 |
| 2016 | $1,372 | $44,560 | $12,600 | $31,960 |
| 2015 | $1,298 | $41,640 | $12,600 | $29,040 |
| 2014 | $1,168 | $37,160 | $12,600 | $24,560 |
| 2013 | -- | $36,280 | $0 | $0 |
Source: Public Records
Map
Nearby Homes
- 125 Meadowview Cir
- 101 Westmont Way
- 0 Georgia 74
- 403 Carriage Oaks Dr
- 0 Erwin Run Unit 10585589
- 125 Westmont Way
- 110 Calypso Ct
- 131 Lincoln Rd
- 240 Lynnwood Ave
- 365 Pendleton Trail
- 500 Laurelwood Dr
- 140 Julie Rd
- 230 Hedgewick Way
- 170 Brennan Dr
- 91 Goodlin Rd
- 200 Chaparral Trace
- 110 Sutton Ct
- 2185 Castle Lake Dr
- 100 Clydesdale Ct
- 105 Delamere Place
- 105 Arrowood Rd
- 125 Arrowood Rd Unit 1
- 150 Arrowood Rd
- 226 Palmetto Rd
- 135 Arrowood Rd
- 110 Point View Ct
- 120 Point View Count Ct
- 214 Palmetto Rd
- 120 Point View Ct
- 120 Point View Ct
- 100 Point View Ct
- 135 Valley View Dr
- 145 Valley View Dr
- 130 Point View Ct
- 155 Valley View Dr
- 237 Palmetto Rd
- 115 Valley View Dr
- 101 Point View Ct Unit 1
- 165 Valley View Dr
- 165 Arrowood Rd