Estimated Value: $99,000 - $121,829
3
Beds
1
Bath
760
Sq Ft
$147/Sq Ft
Est. Value
About This Home
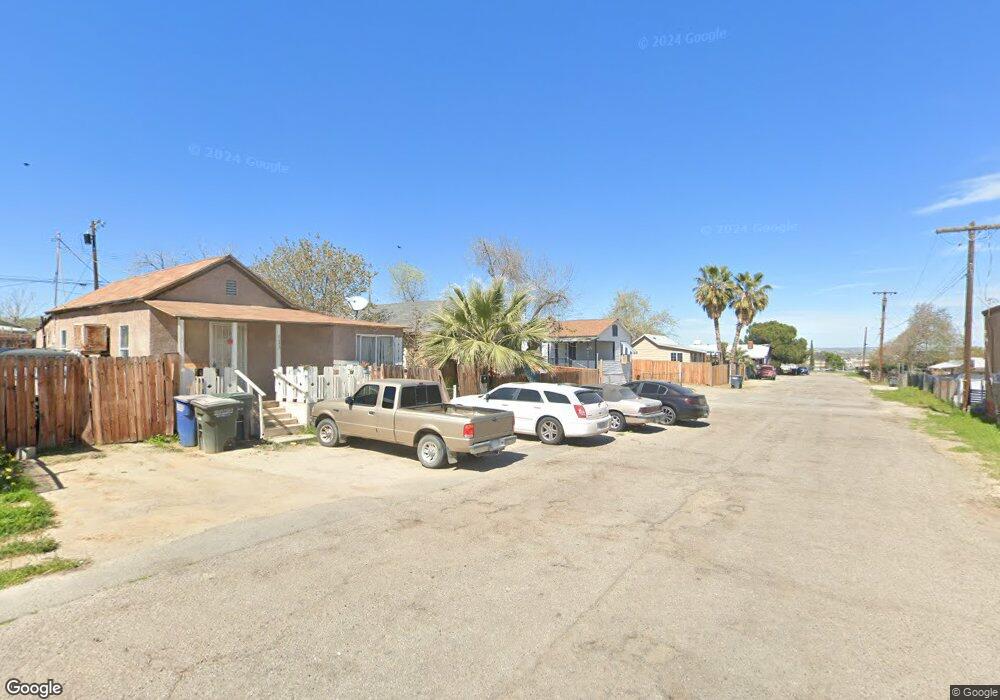
This home is located at 115 Asher Ave, Taft, CA 93268 and is currently estimated at $111,707, approximately $146 per square foot. 115 Asher Ave is a home located in Kern County with nearby schools including Conley Elementary School, Roosevelt Elementary School, and Lincoln Junior High School.
Ownership History
Date
Name
Owned For
Owner Type
Purchase Details
Closed on
Sep 29, 2021
Sold by
Ashcraft Rebecca L
Bought by
Dominguez Manuel and Dominguez Christian
Current Estimated Value
Purchase Details
Closed on
Sep 17, 2003
Sold by
Hoyle Bob D and Hoyle Lea
Bought by
Ashcraft John D and Ashcraft Rebecca L
Purchase Details
Closed on
Jul 24, 1995
Sold by
South Taft Properties Inc
Bought by
Hoyle Bob D and Hoyle Lea
Home Financials for this Owner
Home Financials are based on the most recent Mortgage that was taken out on this home.
Original Mortgage
$21,658
Interest Rate
7.88%
Create a Home Valuation Report for This Property
The Home Valuation Report is an in-depth analysis detailing your home's value as well as a comparison with similar homes in the area
Home Values in the Area
Average Home Value in this Area
Purchase History
| Date | Buyer | Sale Price | Title Company |
|---|---|---|---|
| Dominguez Manuel | $80,000 | First American Title Company | |
| Ashcraft John D | $20,000 | Commonwealth Title | |
| Hoyle Bob D | $12,500 | First American Title Ins Co |
Source: Public Records
Mortgage History
| Date | Status | Borrower | Loan Amount |
|---|---|---|---|
| Previous Owner | Hoyle Bob D | $21,658 |
Source: Public Records
Tax History
| Year | Tax Paid | Tax Assessment Tax Assessment Total Assessment is a certain percentage of the fair market value that is determined by local assessors to be the total taxable value of land and additions on the property. | Land | Improvement |
|---|---|---|---|---|
| 2025 | $1,650 | $84,896 | $21,224 | $63,672 |
| 2024 | $1,650 | $83,232 | $20,808 | $62,424 |
| 2023 | $1,553 | $81,600 | $20,400 | $61,200 |
| 2022 | $1,408 | $80,000 | $20,000 | $60,000 |
| 2021 | $718 | $26,255 | $9,187 | $17,068 |
| 2020 | $718 | $25,986 | $9,093 | $16,893 |
| 2019 | $628 | $25,986 | $9,093 | $16,893 |
| 2018 | $593 | $24,979 | $8,741 | $16,238 |
| 2017 | $582 | $24,490 | $8,570 | $15,920 |
| 2016 | $586 | $24,010 | $8,402 | $15,608 |
| 2015 | $559 | $23,650 | $8,276 | $15,374 |
| 2014 | $543 | $23,187 | $8,114 | $15,073 |
Source: Public Records
Map
Nearby Homes
Your Personal Tour Guide
Ask me questions while you tour the home.