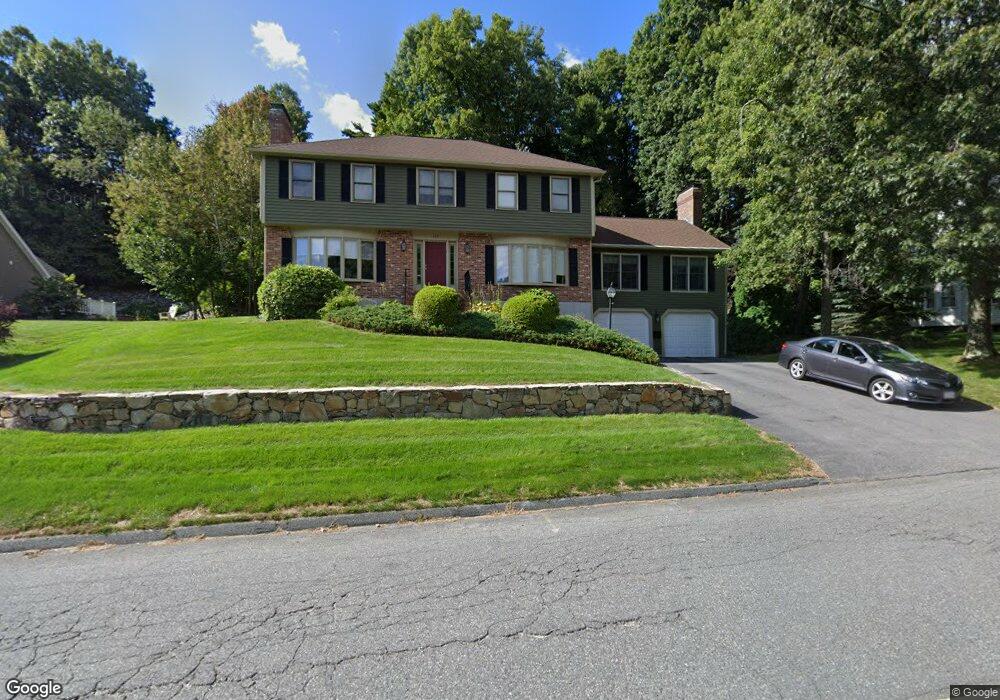
115 Barry Rd Worcester, MA 01609
Forest Grove NeighborhoodEstimated Value: $670,000 - $779,000
4
Beds
3
Baths
3,018
Sq Ft
$243/Sq Ft
Est. Value
About This Home
This home is located at 115 Barry Rd, Worcester, MA 01609 and is currently estimated at $734,210, approximately $243 per square foot. 115 Barry Rd is a home located in Worcester County with nearby schools including Nelson Place Elementary School, Chandler Magnet, and Jacob Hiatt Magnet School.
Ownership History
Date
Name
Owned For
Owner Type
Purchase Details
Closed on
Nov 16, 2020
Sold by
Rosenblum Ft
Bought by
Cruz Isabelo and Shaw Kathryn E
Current Estimated Value
Home Financials for this Owner
Home Financials are based on the most recent Mortgage that was taken out on this home.
Original Mortgage
$397,000
Outstanding Balance
$356,077
Interest Rate
3.25%
Mortgage Type
New Conventional
Estimated Equity
$378,133
Purchase Details
Closed on
Jan 6, 2020
Sold by
Rosenblum Charles S
Bought by
Rosenblum Ft
Purchase Details
Closed on
Jun 21, 2005
Sold by
Devenport Sally J and Williams Sally J
Bought by
Rosenblum Charles S and Berenson Rebecca
Purchase Details
Closed on
Jul 23, 1999
Sold by
Chapman Robert and Chapman Shirley D
Bought by
Williams Sally J
Create a Home Valuation Report for This Property
The Home Valuation Report is an in-depth analysis detailing your home's value as well as a comparison with similar homes in the area
Home Values in the Area
Average Home Value in this Area
Purchase History
| Date | Buyer | Sale Price | Title Company |
|---|---|---|---|
| Cruz Isabelo | $418,000 | None Available | |
| Rosenblum Ft | -- | None Available | |
| Rosenblum Charles S | $416,000 | -- | |
| Williams Sally J | $270,000 | -- |
Source: Public Records
Mortgage History
| Date | Status | Borrower | Loan Amount |
|---|---|---|---|
| Open | Cruz Isabelo | $397,000 | |
| Previous Owner | Williams Sally J | $195,000 | |
| Previous Owner | Williams Sally J | $205,000 |
Source: Public Records
Tax History
| Year | Tax Paid | Tax Assessment Tax Assessment Total Assessment is a certain percentage of the fair market value that is determined by local assessors to be the total taxable value of land and additions on the property. | Land | Improvement |
|---|---|---|---|---|
| 2025 | $8,833 | $669,700 | $123,700 | $546,000 |
| 2024 | $8,581 | $624,100 | $123,700 | $500,400 |
| 2023 | $8,373 | $583,900 | $106,500 | $477,400 |
| 2022 | $7,812 | $513,600 | $85,200 | $428,400 |
| 2021 | $7,995 | $491,100 | $68,200 | $422,900 |
| 2020 | $7,937 | $466,900 | $68,000 | $398,900 |
| 2019 | $8,073 | $448,500 | $65,600 | $382,900 |
| 2018 | $7,961 | $421,000 | $65,600 | $355,400 |
| 2017 | $7,438 | $387,000 | $65,600 | $321,400 |
| 2016 | $7,725 | $374,800 | $54,100 | $320,700 |
| 2015 | $7,522 | $374,800 | $54,100 | $320,700 |
| 2014 | $7,324 | $374,800 | $54,100 | $320,700 |
Source: Public Records
Map
Nearby Homes
- 84 Chester St
- 61 Barry Rd
- 97 Parkton Ave
- 46 Barry Rd
- 90 Bjorklund Ave
- 25 Chester St
- 158 Chester St
- 28 Lynnwood Ln
- 23 Leslie Rd
- 4004 Brompton Cir
- 82 Holden St
- 770 Salisbury St Unit 517
- 770 Salisbury St Unit 333
- 7 Primmett Ln
- 577 Grove St
- 14 Balder Rd
- 42 N Worcester Ave
- 8 Salisbury Hill Blvd Unit 79
- 10 Salisbury Hill Blvd Unit 75
- 36 Eagle Rd
- 111 Barry Rd Extension
- 111 Barry Rd
- 117 Barry Rd
- 114 Barry Rd
- 109 Barry Rd
- 112 Barry Rd
- 121 Barry Rd
- 116 Barry Rd
- 110 Barry Rd
- 95 W Chester St
- 79 W Chester St
- 75-77 W Chester St
- 108 Barry Rd
- 92 W Chester St
- 71-73 W Chester St
- 106 Barry Rd
- 73 W Chester St
- 90 W Chester St
- 76 Toronita Ave Unit 1
- 78 Toronita Ave
Your Personal Tour Guide
Ask me questions while you tour the home.