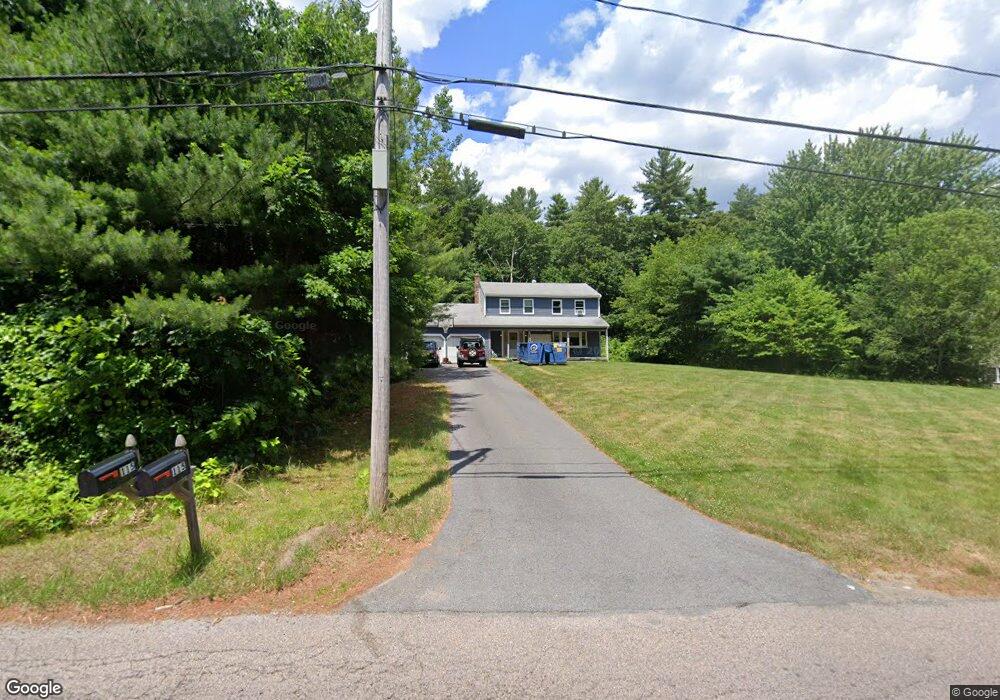
115 Beech St Bridgewater, MA 02324
Estimated Value: $637,763 - $717,000
4
Beds
3
Baths
1,824
Sq Ft
$371/Sq Ft
Est. Value
About This Home
This home is located at 115 Beech St, Bridgewater, MA 02324 and is currently estimated at $675,941, approximately $370 per square foot. 115 Beech St is a home located in Plymouth County with nearby schools including Mitchell Elementary School, Williams Intermediate School, and Bridgewater Middle School.
Ownership History
Date
Name
Owned For
Owner Type
Purchase Details
Closed on
Sep 26, 1997
Sold by
Gass Matthew S
Bought by
Lacivita Christopher and Lacivitta Wendi R
Current Estimated Value
Purchase Details
Closed on
Jun 21, 1994
Sold by
Lot One Beech St T
Bought by
Gass Matthew S
Create a Home Valuation Report for This Property
The Home Valuation Report is an in-depth analysis detailing your home's value as well as a comparison with similar homes in the area
Home Values in the Area
Average Home Value in this Area
Purchase History
| Date | Buyer | Sale Price | Title Company |
|---|---|---|---|
| Lacivita Christopher | $200,000 | -- | |
| Gass Matthew S | $179,900 | -- |
Source: Public Records
Mortgage History
| Date | Status | Borrower | Loan Amount |
|---|---|---|---|
| Open | Gass Matthew S | $240,300 | |
| Closed | Gass Matthew S | $230,500 | |
| Closed | Gass Matthew S | $80,000 |
Source: Public Records
Tax History
| Year | Tax Paid | Tax Assessment Tax Assessment Total Assessment is a certain percentage of the fair market value that is determined by local assessors to be the total taxable value of land and additions on the property. | Land | Improvement |
|---|---|---|---|---|
| 2025 | $7,055 | $596,400 | $205,400 | $391,000 |
| 2024 | $6,857 | $564,800 | $195,600 | $369,200 |
| 2023 | $6,791 | $528,900 | $182,800 | $346,100 |
| 2022 | $6,602 | $461,000 | $160,400 | $300,600 |
| 2021 | $6,011 | $415,100 | $143,200 | $271,900 |
| 2020 | $5,929 | $402,500 | $137,600 | $264,900 |
| 2019 | $5,744 | $387,300 | $137,600 | $249,700 |
| 2018 | $5,458 | $359,300 | $127,300 | $232,000 |
| 2017 | $5,265 | $337,300 | $127,300 | $210,000 |
| 2016 | $5,030 | $323,700 | $124,800 | $198,900 |
| 2015 | $5,057 | $311,400 | $121,100 | $190,300 |
| 2014 | $4,854 | $298,700 | $111,600 | $187,100 |
Source: Public Records
Map
Nearby Homes
Your Personal Tour Guide
Ask me questions while you tour the home.