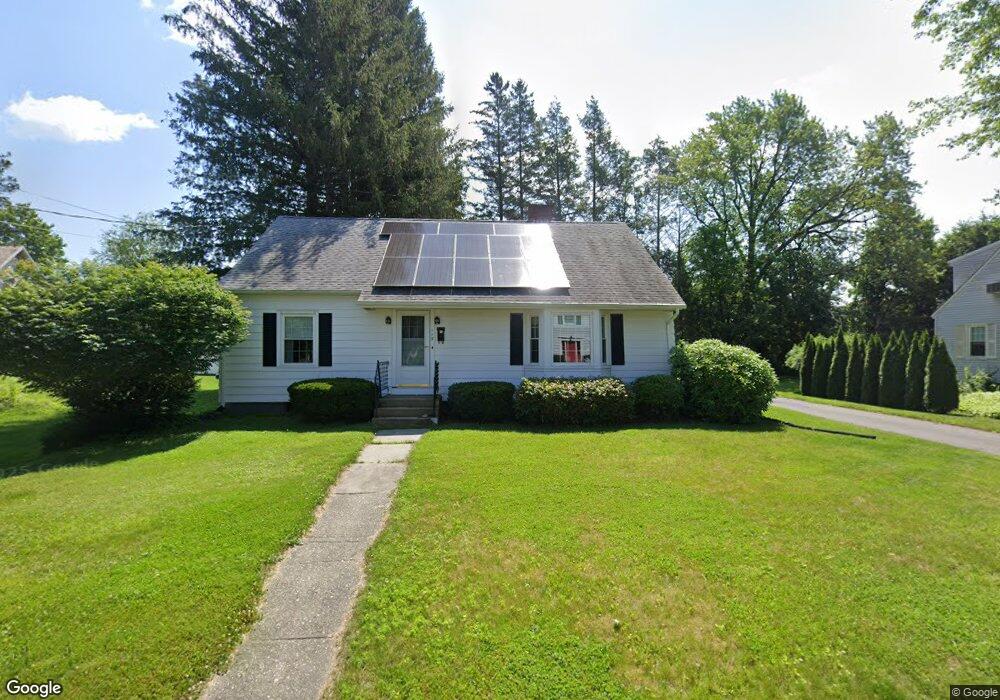
115 Birch St Greenfield, MA 01301
Estimated Value: $274,000 - $350,000
3
Beds
1
Bath
1,502
Sq Ft
$218/Sq Ft
Est. Value
About This Home
This home is located at 115 Birch St, Greenfield, MA 01301 and is currently estimated at $326,705, approximately $217 per square foot. 115 Birch St is a home located in Franklin County with nearby schools including Cornerstone Christian School, Holy Trinity School, and Stoneleigh-Burnham School.
Ownership History
Date
Name
Owned For
Owner Type
Purchase Details
Closed on
May 7, 2015
Sold by
Kells John J
Bought by
Kells David B
Current Estimated Value
Purchase Details
Closed on
Feb 27, 1995
Sold by
Murphy Alice G and Hagan Sharon A
Bought by
Kells John J
Home Financials for this Owner
Home Financials are based on the most recent Mortgage that was taken out on this home.
Original Mortgage
$40,000
Interest Rate
9.17%
Mortgage Type
Purchase Money Mortgage
Create a Home Valuation Report for This Property
The Home Valuation Report is an in-depth analysis detailing your home's value as well as a comparison with similar homes in the area
Home Values in the Area
Average Home Value in this Area
Purchase History
| Date | Buyer | Sale Price | Title Company |
|---|---|---|---|
| Kells David B | -- | -- | |
| Kells David B | -- | -- | |
| Kells John J | $82,500 | -- | |
| Kells John J | $82,500 | -- |
Source: Public Records
Mortgage History
| Date | Status | Borrower | Loan Amount |
|---|---|---|---|
| Previous Owner | Kells John J | $40,000 |
Source: Public Records
Tax History Compared to Growth
Tax History
| Year | Tax Paid | Tax Assessment Tax Assessment Total Assessment is a certain percentage of the fair market value that is determined by local assessors to be the total taxable value of land and additions on the property. | Land | Improvement |
|---|---|---|---|---|
| 2025 | $5,455 | $278,900 | $72,200 | $206,700 |
| 2024 | $5,369 | $263,300 | $59,400 | $203,900 |
| 2023 | $4,840 | $246,300 | $59,400 | $186,900 |
| 2022 | $4,705 | $210,800 | $56,600 | $154,200 |
| 2021 | $4,335 | $186,700 | $56,600 | $130,100 |
| 2020 | $4,160 | $181,400 | $56,600 | $124,800 |
| 2019 | $3,891 | $174,000 | $49,200 | $124,800 |
| 2018 | $3,818 | $170,200 | $48,100 | $122,100 |
| 2017 | $3,698 | $170,200 | $48,100 | $122,100 |
| 2016 | $3,762 | $172,500 | $50,900 | $121,600 |
| 2015 | $3,712 | $164,900 | $50,900 | $114,000 |
| 2014 | -- | $164,900 | $50,900 | $114,000 |
Source: Public Records
Map
Nearby Homes