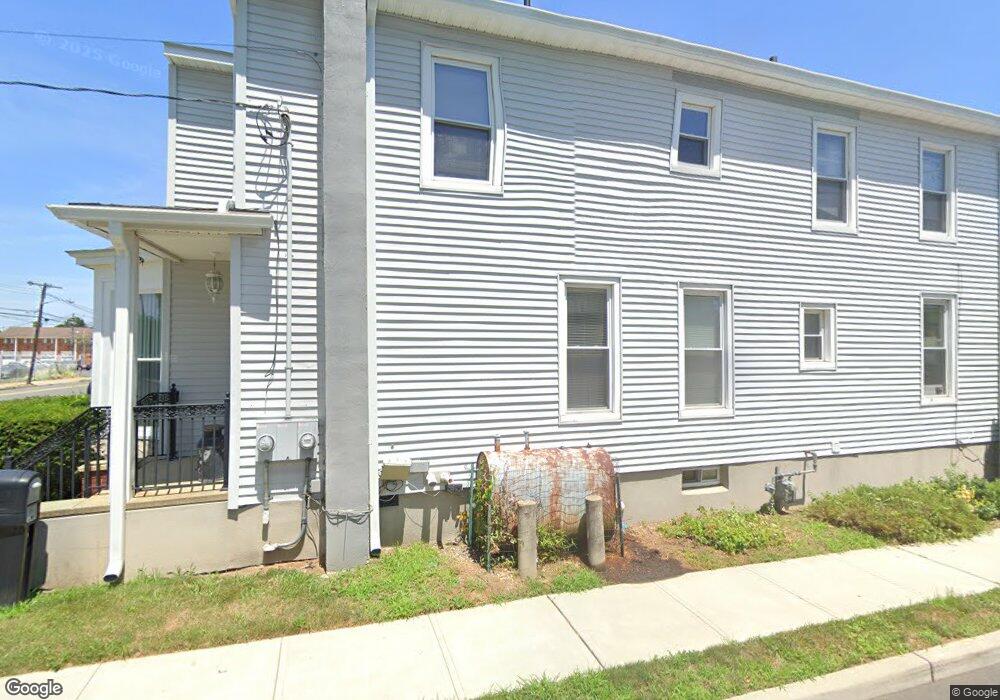
115 Broad St Matawan, NJ 07747
Estimated Value: $570,698 - $684,000
3
Beds
2
Baths
2,220
Sq Ft
$274/Sq Ft
Est. Value
About This Home
This home is located at 115 Broad St, Matawan, NJ 07747 and is currently estimated at $608,425, approximately $274 per square foot. 115 Broad St is a home located in Monmouth County with nearby schools including Matawan Reg High School, St. Joseph Elementary School, and Icob Academy.
Ownership History
Date
Name
Owned For
Owner Type
Purchase Details
Closed on
Oct 5, 2007
Sold by
Harrington Carol L and Harrington Patricia E
Bought by
Harrington Carol L
Current Estimated Value
Home Financials for this Owner
Home Financials are based on the most recent Mortgage that was taken out on this home.
Original Mortgage
$280,000
Outstanding Balance
$176,444
Interest Rate
6.39%
Mortgage Type
Commercial
Estimated Equity
$431,981
Purchase Details
Closed on
May 17, 2006
Sold by
Mayer Charles H
Bought by
Harrington Carol L and Harrington Patricia E
Home Financials for this Owner
Home Financials are based on the most recent Mortgage that was taken out on this home.
Original Mortgage
$255,440
Interest Rate
7.75%
Mortgage Type
Commercial
Create a Home Valuation Report for This Property
The Home Valuation Report is an in-depth analysis detailing your home's value as well as a comparison with similar homes in the area
Home Values in the Area
Average Home Value in this Area
Purchase History
| Date | Buyer | Sale Price | Title Company |
|---|---|---|---|
| Harrington Carol L | -- | Grey Street Title Agency Lp | |
| Harrington Carol L | $319,300 | -- |
Source: Public Records
Mortgage History
| Date | Status | Borrower | Loan Amount |
|---|---|---|---|
| Open | Harrington Carol L | $280,000 | |
| Closed | Harrington Carol L | $255,440 |
Source: Public Records
Tax History
| Year | Tax Paid | Tax Assessment Tax Assessment Total Assessment is a certain percentage of the fair market value that is determined by local assessors to be the total taxable value of land and additions on the property. | Land | Improvement |
|---|---|---|---|---|
| 2025 | $10,103 | $497,700 | $261,000 | $236,700 |
| 2024 | $9,824 | $462,800 | $274,500 | $188,300 |
Source: Public Records
Map
Nearby Homes
Your Personal Tour Guide
Ask me questions while you tour the home.