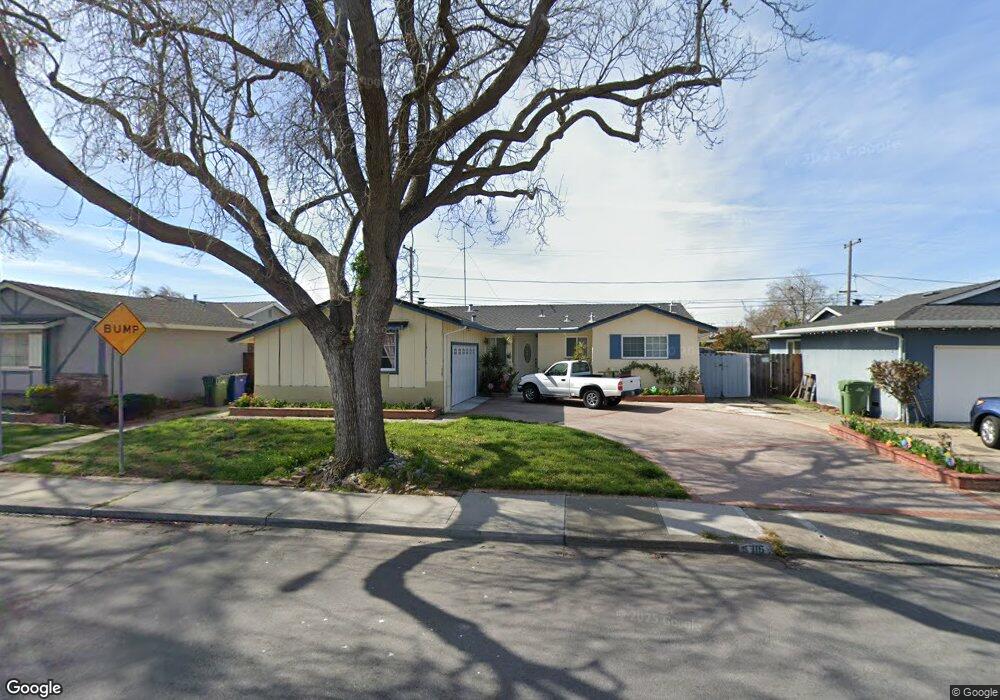
115 Butler St Milpitas, CA 95035
Estimated Value: $1,325,000 - $1,523,000
3
Beds
2
Baths
1,116
Sq Ft
$1,266/Sq Ft
Est. Value
About This Home
This home is located at 115 Butler St, Milpitas, CA 95035 and is currently estimated at $1,412,556, approximately $1,265 per square foot. 115 Butler St is a home located in Santa Clara County with nearby schools including Anthony Spangler Elementary School, Thomas Russell Middle School, and Milpitas High School.
Ownership History
Date
Name
Owned For
Owner Type
Purchase Details
Closed on
Jul 5, 2012
Sold by
Deguzman Richard M and De Guzman Pricsila D
Bought by
Deguzman Richard M and Deguzman Pricsila D
Current Estimated Value
Purchase Details
Closed on
Jun 30, 1995
Sold by
Smith James L and Smith Jacqueline Y
Bought by
Deguzman Richard M and Deguzman Depriscila D
Home Financials for this Owner
Home Financials are based on the most recent Mortgage that was taken out on this home.
Original Mortgage
$156,000
Interest Rate
7.88%
Create a Home Valuation Report for This Property
The Home Valuation Report is an in-depth analysis detailing your home's value as well as a comparison with similar homes in the area
Home Values in the Area
Average Home Value in this Area
Purchase History
We collect this data history from publicly available records. To have your information removed, we recommend requesting removal directly through your county’s website.
| Date | Buyer | Sale Price | Title Company |
|---|---|---|---|
| Deguzman Richard M | -- | None Available | |
| Deguzman Richard M | $195,000 | Chicago Title |
Source: Public Records
Mortgage History
We collect this data history from publicly available records. To have your information removed, we recommend requesting removal directly through your county’s website.
| Date | Status | Borrower | Loan Amount |
|---|---|---|---|
| Closed | Deguzman Richard M | $156,000 |
Source: Public Records
Tax History
| Year | Tax Paid | Tax Assessment Tax Assessment Total Assessment is a certain percentage of the fair market value that is determined by local assessors to be the total taxable value of land and additions on the property. | Land | Improvement |
|---|---|---|---|---|
| 2025 | $3,860 | $327,511 | $147,293 | $180,218 |
| 2024 | $3,860 | $321,090 | $144,405 | $176,685 |
| 2023 | $3,846 | $314,795 | $141,574 | $173,221 |
| 2022 | $3,832 | $308,624 | $138,799 | $169,825 |
| 2021 | $3,775 | $302,574 | $136,078 | $166,496 |
| 2020 | $3,710 | $299,472 | $134,683 | $164,789 |
| 2019 | $3,669 | $293,601 | $132,043 | $161,558 |
| 2018 | $3,490 | $287,845 | $129,454 | $158,391 |
| 2017 | $3,444 | $282,202 | $126,916 | $155,286 |
| 2016 | $3,302 | $276,670 | $124,428 | $152,242 |
| 2015 | $3,268 | $272,515 | $122,559 | $149,956 |
| 2014 | $3,168 | $267,178 | $120,159 | $147,019 |
Source: Public Records
Map
Nearby Homes
- 73 Images Cir
- 50 Serra Way
- 0 Railroad Ave
- 170 Marylinn Dr
- 7280 Marylinn Dr
- 650 Vasona St
- 352 San Petra Ct Unit 1
- 764 Lexington St
- 131 Caladenia Ln
- 63 Chysis Rd
- 770 Claridad Loop
- 760 Mente Linda Loop
- 1094 Mente Linda Loop
- 915 Ternura Loop
- 513 Glenmoor Cir
- 1030 Luz Del Sol Loop Unit 3C
- 668 Erie Cir
- 648 S Main St
- 662 Ohlone St
- 682 Ohlone St
Your Personal Tour Guide
Ask me questions while you tour the home.