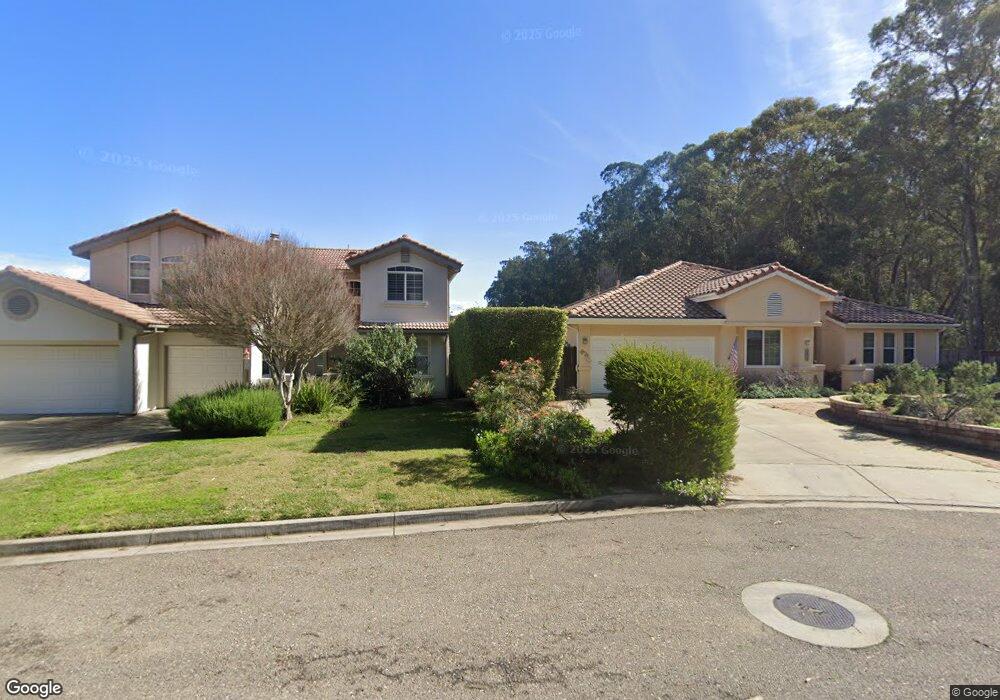
115 Butterfly Ln Los Osos, CA 93402
Estimated Value: $1,156,204 - $1,300,000
3
Beds
2
Baths
2,047
Sq Ft
$607/Sq Ft
Est. Value
About This Home
This home is located at 115 Butterfly Ln, Los Osos, CA 93402 and is currently estimated at $1,243,301, approximately $607 per square foot. 115 Butterfly Ln is a home located in San Luis Obispo County with nearby schools including Monarch Grove Elementary School, Los Osos Middle School, and Morro Bay High School.
Ownership History
Date
Name
Owned For
Owner Type
Purchase Details
Closed on
Feb 10, 2021
Sold by
Powell William P and Powell Constance M
Bought by
William P Powell And Constance Powell 2021 Tr and Powell
Current Estimated Value
Purchase Details
Closed on
Oct 16, 2009
Sold by
Hillman Paul E and Hillman Beverly J
Bought by
Powell William P and Powell Constance M Bradford
Purchase Details
Closed on
Jul 6, 2006
Sold by
Hillman Paul E and Hillman Beverly J
Bought by
Hillman Paul E and Hillman Beverly J
Home Financials for this Owner
Home Financials are based on the most recent Mortgage that was taken out on this home.
Original Mortgage
$599,200
Interest Rate
7%
Mortgage Type
New Conventional
Purchase Details
Closed on
Dec 1, 1998
Sold by
Morgan Robert Edward and Morgan Glenda Kaye
Bought by
Morgan Robert Edward and Moran Glenda Kay
Purchase Details
Closed on
Apr 14, 1998
Sold by
Anastasi Development Corp
Bought by
Morgan Robert E and Morgan Glenda K
Create a Home Valuation Report for This Property
The Home Valuation Report is an in-depth analysis detailing your home's value as well as a comparison with similar homes in the area
Home Values in the Area
Average Home Value in this Area
Purchase History
| Date | Buyer | Sale Price | Title Company |
|---|---|---|---|
| William P Powell And Constance Powell 2021 Tr | -- | None Listed On Document | |
| Powell William P | $561,000 | First American Title Company | |
| Hillman Paul E | -- | Chicago Title Co | |
| Hillman Paul E | $749,000 | Chicago Title Co | |
| Morgan Robert Edward | -- | -- | |
| Morgan Robert E | $292,000 | Fidelity National Title Co |
Source: Public Records
Mortgage History
| Date | Status | Borrower | Loan Amount |
|---|---|---|---|
| Previous Owner | Hillman Paul E | $599,200 |
Source: Public Records
Tax History Compared to Growth
Tax History
| Year | Tax Paid | Tax Assessment Tax Assessment Total Assessment is a certain percentage of the fair market value that is determined by local assessors to be the total taxable value of land and additions on the property. | Land | Improvement |
|---|---|---|---|---|
| 2025 | $10,052 | $728,011 | $387,241 | $340,770 |
| 2024 | $9,763 | $713,738 | $379,649 | $334,089 |
| 2023 | $9,763 | $699,744 | $372,205 | $327,539 |
| 2022 | $9,547 | $686,024 | $364,907 | $321,117 |
| 2021 | $9,170 | $672,573 | $357,752 | $314,821 |
| 2020 | $9,295 | $665,677 | $354,084 | $311,593 |
| 2019 | $8,857 | $652,626 | $347,142 | $305,484 |
| 2018 | $6,891 | $639,831 | $340,336 | $299,495 |
| 2017 | $6,754 | $627,286 | $333,663 | $293,623 |
| 2016 | $6,620 | $614,987 | $327,121 | $287,866 |
| 2015 | $6,517 | $605,750 | $322,208 | $283,542 |
| 2014 | $5,990 | $593,885 | $315,897 | $277,988 |
Source: Public Records
Map
Nearby Homes
- 2341 Humboldt St
- 125 Butterfly Ln
- 2350 Inyo St
- 135 Butterfly Ln
- 2340 Inyo St
- 2340 Inyo St
- 2330 Humboldt St
- 2330 Inyo St
- 2321 Humboldt St
- 145 Butterfly Ln
- 2320 Humboldt St
- 2331 Glenn St
- 2320 Inyo St
- 2311 Humboldt St
- 2321 Glenn St
- 2310 Humboldt St
- 155 Butterfly Ln
- 2310 Inyo St
- 2331 Inyo St
- 2311 Glenn St