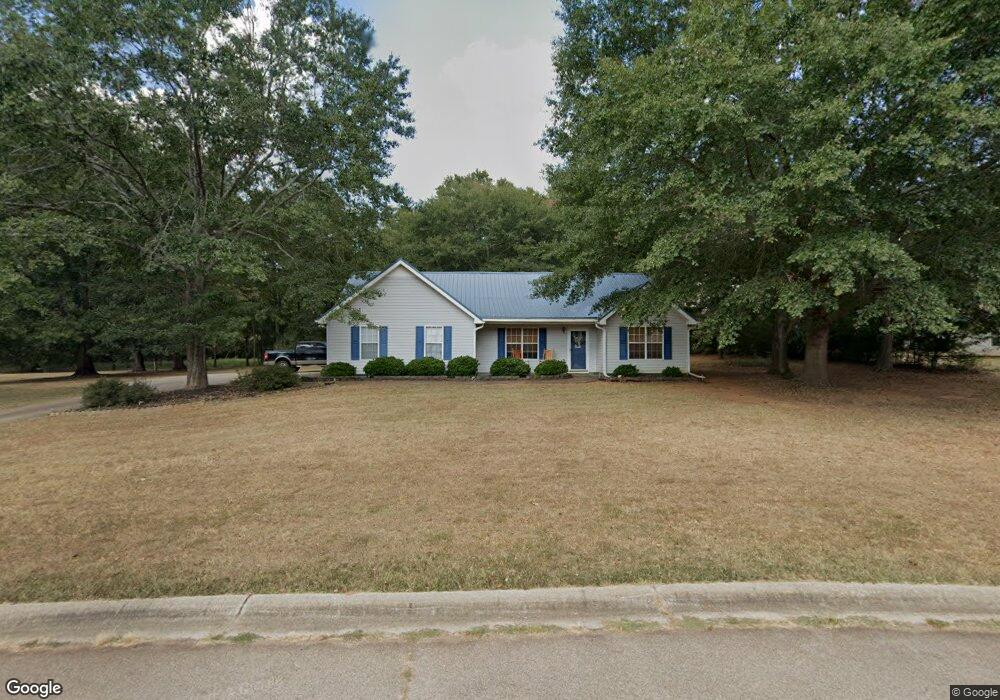
115 Carriage Trace Barnesville, GA 30204
Estimated Value: $249,720 - $324,000
3
Beds
2
Baths
1,477
Sq Ft
$187/Sq Ft
Est. Value
About This Home
This home is located at 115 Carriage Trace, Barnesville, GA 30204 and is currently estimated at $275,930, approximately $186 per square foot. 115 Carriage Trace is a home located in Lamar County with nearby schools including Lamar County Primary School, Lamar County Elementary School, and Lamar County Middle School.
Ownership History
Date
Name
Owned For
Owner Type
Purchase Details
Closed on
Sep 26, 2017
Sold by
Robinson Jerry A
Bought by
Robinson Jerry A and Robinson Cindy
Current Estimated Value
Home Financials for this Owner
Home Financials are based on the most recent Mortgage that was taken out on this home.
Original Mortgage
$114,782
Outstanding Balance
$96,596
Interest Rate
4.37%
Mortgage Type
FHA
Estimated Equity
$179,334
Purchase Details
Closed on
Sep 25, 2017
Sold by
Morton Velma Lynn
Bought by
Robinson Jerry A
Home Financials for this Owner
Home Financials are based on the most recent Mortgage that was taken out on this home.
Original Mortgage
$114,782
Outstanding Balance
$96,596
Interest Rate
4.37%
Mortgage Type
FHA
Estimated Equity
$179,334
Purchase Details
Closed on
May 15, 2000
Sold by
Housing Res Un Ltd
Bought by
Morton Michael A
Create a Home Valuation Report for This Property
The Home Valuation Report is an in-depth analysis detailing your home's value as well as a comparison with similar homes in the area
Home Values in the Area
Average Home Value in this Area
Purchase History
| Date | Buyer | Sale Price | Title Company |
|---|---|---|---|
| Robinson Jerry A | $116,900 | -- | |
| Robinson Jerry A | $116,900 | -- | |
| Robinson Jerry A | -- | -- | |
| Morton Michael A | $99,000 | -- |
Source: Public Records
Mortgage History
| Date | Status | Borrower | Loan Amount |
|---|---|---|---|
| Open | Robinson Jerry A | $114,782 | |
| Closed | Robinson Jerry A | $114,782 |
Source: Public Records
Tax History
| Year | Tax Paid | Tax Assessment Tax Assessment Total Assessment is a certain percentage of the fair market value that is determined by local assessors to be the total taxable value of land and additions on the property. | Land | Improvement |
|---|---|---|---|---|
| 2025 | $2,268 | $93,781 | $8,000 | $85,781 |
| 2024 | $2,185 | $77,937 | $8,000 | $69,937 |
| 2023 | $2,228 | $73,861 | $8,000 | $65,861 |
| 2022 | $1,805 | $67,288 | $8,000 | $59,288 |
| 2021 | $1,532 | $52,872 | $6,000 | $46,872 |
| 2020 | $1,491 | $47,112 | $6,000 | $41,112 |
| 2019 | $1,495 | $47,112 | $6,000 | $41,112 |
| 2018 | $1,262 | $41,429 | $6,000 | $35,429 |
| 2017 | $1,198 | $41,429 | $6,000 | $35,429 |
| 2016 | $1,199 | $41,429 | $6,000 | $35,429 |
| 2015 | $1,194 | $41,429 | $6,000 | $35,429 |
| 2014 | $1,157 | $41,429 | $6,000 | $35,429 |
| 2013 | -- | $41,428 | $6,000 | $35,428 |
Source: Public Records
Map
Nearby Homes
- 514 Highway 18 W
- 696 Highway 18 W
- 696 Georgia 18
- 109 Barnesville Ave
- 144 U S 341
- 00 U S 341
- 178 Barnesville Ave
- 13 Brown St
- 255 Needleleaf Dr
- 121 Westchester Dr
- 275 Rose Ave
- 270 Cannafax Rd
- 149 Akins St
- 642 Greenwood St
- 163 Grove St
- 531 Thomaston St
- 334 Atlanta St
- 114 Stafford Ave
- 147 Stafford Ave
- 339 Atlanta St
- 117 Carriage Trace
- 113 Carriage Trace
- 107 Carriage Trace
- 109 Carriage Trace
- 111 Carriage Trace Unit 15
- 111 Carriage Trace
- 105 Carriage Trace
- 119 Carriage Trace
- 124 Oneal Rd
- 103 Carriage Trace
- 169 Burnette Rd
- 167 Burnette Rd
- 544 Highway 18 W
- 566 Highway 18 W
- 122 Oneal Rd Unit 3
- 122 Oneal Rd
- 171 Burnette Rd
- 171 Burnette Rd
- 121 Carriage Trace Unit 20
- 121 Carriage Trace
Your Personal Tour Guide
Ask me questions while you tour the home.