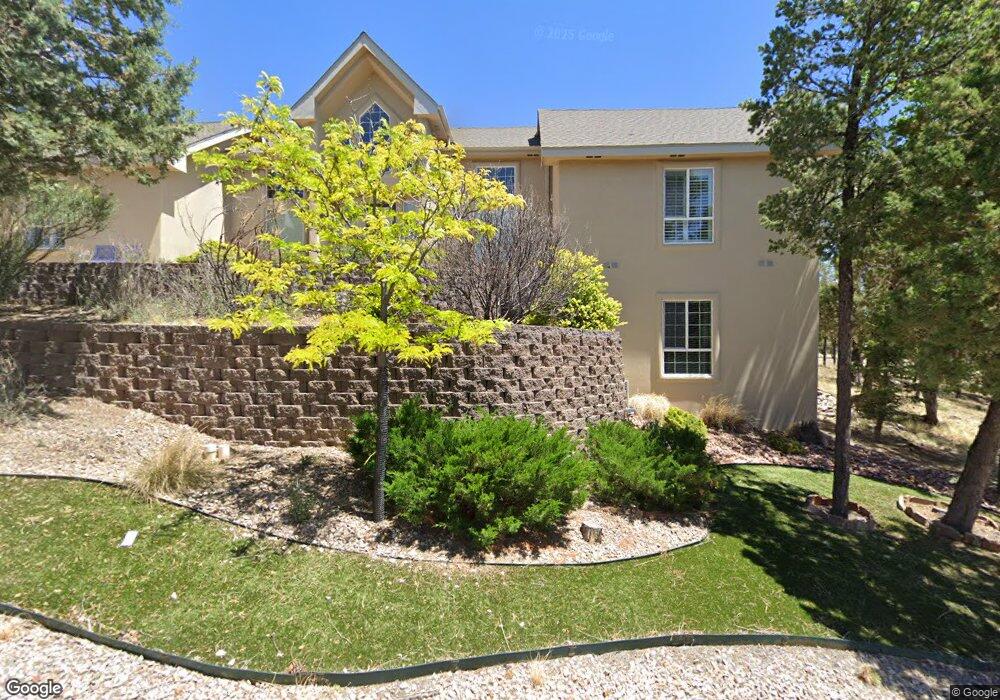
115 Coker Ln Unit 1 Ruidoso, NM 88345
Estimated Value: $722,000
4
Beds
3
Baths
2,584
Sq Ft
$279/Sq Ft
Est. Value
About This Home
This home is located at 115 Coker Ln Unit 1, Ruidoso, NM 88345 and is currently estimated at $722,000, approximately $279 per square foot. 115 Coker Ln Unit 1 is a home located in Lincoln County with nearby schools including Sierra Vista Primary School, White Mountain Elementary School, and Ruidoso Middle School.
Ownership History
Date
Name
Owned For
Owner Type
Purchase Details
Closed on
Aug 9, 2021
Sold by
Delusque Michael R and Delusque Sandra E
Bought by
Delsque Properties Llc
Current Estimated Value
Purchase Details
Closed on
Dec 23, 2019
Sold by
Delusque Michael R and Delusque Sandra E
Bought by
Delusque Michael R and Delusque Sandra E
Purchase Details
Closed on
Jun 5, 2018
Sold by
Franklin Harold Gene and Franklin H
Bought by
Delusque Michael R and Delusque Sandra E
Purchase Details
Closed on
Jun 19, 2017
Sold by
Franklin Linda Huffaker
Bought by
Franklin Harold Gene
Purchase Details
Closed on
Apr 16, 2013
Sold by
Greenhaw Morris R and Greenhaw Patricia A
Bought by
Franklin H G and Huffaker Linda Cribbs
Purchase Details
Closed on
Jan 9, 2008
Sold by
Kolstad Martin A and Kolstad Lorraine G
Bought by
Greenhaw Morris R and Greenhaw Patricia A
Purchase Details
Closed on
May 18, 2005
Sold by
Sonora Corp
Bought by
Kolstad Martin A and Kolstad Lorraine G
Create a Home Valuation Report for This Property
The Home Valuation Report is an in-depth analysis detailing your home's value as well as a comparison with similar homes in the area
Home Values in the Area
Average Home Value in this Area
Purchase History
| Date | Buyer | Sale Price | Title Company |
|---|---|---|---|
| Delsque Properties Llc | -- | None Available | |
| Delusque Michael R | -- | None Available | |
| Delusque Michael R | -- | None Available | |
| Franklin Harold Gene | -- | None Available | |
| Franklin H G | -- | None Available | |
| Greenhaw Morris R | -- | None Available | |
| Kolstad Martin A | -- | Gsv |
Source: Public Records
Tax History Compared to Growth
Tax History
| Year | Tax Paid | Tax Assessment Tax Assessment Total Assessment is a certain percentage of the fair market value that is determined by local assessors to be the total taxable value of land and additions on the property. | Land | Improvement |
|---|---|---|---|---|
| 2025 | $4,337 | $152,490 | $28,139 | $124,351 |
| 2024 | $4,337 | $148,048 | $27,319 | $120,729 |
| 2023 | $4,337 | $143,736 | $26,523 | $117,213 |
| 2022 | $4,497 | $139,549 | $25,750 | $113,799 |
| 2021 | $4,198 | $139,535 | $25,747 | $113,788 |
| 2020 | $4,237 | $139,535 | $25,747 | $113,788 |
| 2019 | $4,043 | $139,535 | $25,747 | $113,788 |
| 2018 | $4,019 | $139,535 | $25,747 | $113,788 |
| 2017 | $3,868 | $135,471 | $24,998 | $110,473 |
| 2015 | $3,877 | $135,484 | $25,000 | $110,484 |
| 2014 | $3,877 | $135,484 | $25,000 | $110,484 |
Source: Public Records
Map
Nearby Homes
- 110 Coker Ln
- 111 Coker Ln
- 112 Top Side Dr
- 103 Coker Ln
- 111 Top Side Dr
- 425 White Mountain Meadows Dr
- 122 Tuscan Dr
- 125 Top Side Dr
- 105 Wagon Trail
- 700 Gavilan Canyon Rd
- 143 Charles McClellan Dr
- 116 Pat Thompson Ct
- 118 Charles McClellan Dr
- 113 Charles McClellan Dr
- 545 White Mountain Meadows Dr
- 551 White Mountain Meadows Dr
- 105 Milagro Hills Ct
- 107 Pat Thompson Ct
- 104 Pat Thompson Ct
- 320 White Mountain Meadows Dr
- 115 Coker Ln
- 115 Coker Ln
- 110 Coker Ln Unit 1
- 112 Coker Ln Unit 1
- 413 White Mountain Meadows Dr Unit 1
- 111 Coker Ln Unit 1
- 113 Coker Ln
- 415 White Mountain Meadows Dr
- 415 White Mountain Meadows Dr Unit 1
- 408 White Mountain Meadows Dr
- 408 White Mountain Meadows Dr Unit 1
- 410 White Mountain Meadows Dr
- 412 White Mountain Meadows Dr Unit 1
- 417 White Mountain Meadows Dr
- 417 White Mountain Meadows Dr Unit 1
- 419 White Mountain Meadows Dr Unit 1
- 105 Coker Ln
- 105 Coker Ln
- 421 White Mountain Meadows Dr
- 421 White Mountain Meadows Dr Unit 1