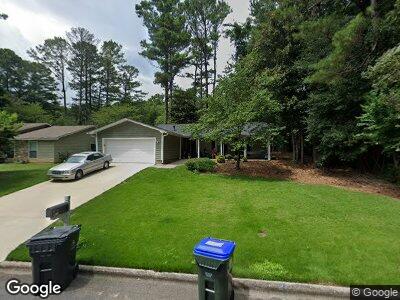
115 Creekmont Ct Unit 1 Roswell, GA 30076
Estimated Value: $375,000 - $448,000
3
Beds
2
Baths
1,511
Sq Ft
$278/Sq Ft
Est. Value
About This Home
This home is located at 115 Creekmont Ct Unit 1, Roswell, GA 30076 and is currently estimated at $419,718, approximately $277 per square foot. 115 Creekmont Ct Unit 1 is a home located in Fulton County with nearby schools including Hillside Elementary School, Haynes Bridge Middle School, and Centennial High School.
Ownership History
Date
Name
Owned For
Owner Type
Purchase Details
Closed on
Oct 24, 2017
Sold by
2012 B Property Holdings L
Bought by
Tah Ms Borrower Llc
Current Estimated Value
Purchase Details
Closed on
Nov 2, 2012
Sold by
Stokes Thomas
Bought by
2012 B Property Holdings Llc
Home Financials for this Owner
Home Financials are based on the most recent Mortgage that was taken out on this home.
Original Mortgage
$104,913
Interest Rate
3.64%
Mortgage Type
New Conventional
Purchase Details
Closed on
Dec 31, 2002
Sold by
Epic Ix Llc
Bought by
Stokes Thomas
Home Financials for this Owner
Home Financials are based on the most recent Mortgage that was taken out on this home.
Original Mortgage
$117,750
Interest Rate
5.89%
Mortgage Type
Stand Alone Second
Purchase Details
Closed on
Aug 19, 2002
Sold by
Beebe Melinda S
Bought by
Epic Ix Llc
Create a Home Valuation Report for This Property
The Home Valuation Report is an in-depth analysis detailing your home's value as well as a comparison with similar homes in the area
Home Values in the Area
Average Home Value in this Area
Purchase History
| Date | Buyer | Sale Price | Title Company |
|---|---|---|---|
| Tah Ms Borrower Llc | -- | -- | |
| 2012 B Property Holdings Llc | $110,000 | -- | |
| Stokes Thomas | -- | -- | |
| Stokes Thomas | -- | -- | |
| Epic Ix Llc | $95,000 | -- |
Source: Public Records
Mortgage History
| Date | Status | Borrower | Loan Amount |
|---|---|---|---|
| Previous Owner | Stokes Thomas | $104,913 | |
| Previous Owner | Stokes Thomas | $117,750 | |
| Previous Owner | Stokes Thomas | $136,000 | |
| Previous Owner | Beebe Melinda S | $39,000 |
Source: Public Records
Tax History Compared to Growth
Tax History
| Year | Tax Paid | Tax Assessment Tax Assessment Total Assessment is a certain percentage of the fair market value that is determined by local assessors to be the total taxable value of land and additions on the property. | Land | Improvement |
|---|---|---|---|---|
| 2023 | $4,085 | $144,720 | $33,000 | $111,720 |
| 2022 | $2,347 | $89,200 | $19,520 | $69,680 |
| 2021 | $2,841 | $89,200 | $19,520 | $69,680 |
| 2020 | $2,483 | $89,200 | $19,520 | $69,680 |
| 2019 | $434 | $87,640 | $19,200 | $68,440 |
| 2018 | $2,108 | $74,680 | $15,280 | $59,400 |
| 2017 | $1,535 | $52,600 | $13,200 | $39,400 |
| 2016 | $1,535 | $52,600 | $13,200 | $39,400 |
| 2015 | $1,828 | $52,600 | $13,200 | $39,400 |
| 2014 | $1,264 | $41,240 | $16,360 | $24,880 |
Source: Public Records
Map
Nearby Homes
- 555 Creekwood Crossing E
- 875 Waterbrook Ct
- 1360 Terramont Dr Unit 4
- 755 Waterbrook Terrace
- 815 Lake Forest Pass
- 985 Lake Haven Ct
- 9415 Martin Rd
- 1835 Old Alabama Rd
- 115 Lake Pines Ct
- 150 N Pond Ct Unit 1
- 195 Sailwind Ct
- 9985 Lake Forest Way
- 215 Scott Crossing
- 130 Floss Flower Ct Unit 3C
- 340 Teal Ct
- 386 Teal Ct
- 394 Teal Ct
- 115 Creekmont Ct Unit 1
- 0 Creekmont Ct Unit 39 7116916
- 0 Creekmont Ct Unit 8162573
- 0 Creekmont Ct Unit 8046692
- 0 Creekmont Ct Unit 39
- 125 Creekmont Ct Unit 39
- 125 Creekmont Ct
- 1105 Terramont Dr Unit 1
- 655 Creekwood Crossing W
- 1115 Terramont Dr
- 665 Creekwood Crossing W Unit 665
- 665 Creekwood Crossing W
- 665 Creekwood Crossing W
- 110 Creekmont Ct
- 135 Creekmont Ct
- 1125 Terramont Dr
- 100 Creekmont Ct Unit 1
- 120 Creekmont Ct
- 675 Creekwood Crossing W Unit 2
- 0 Creekwood Crossing W Unit 7398986