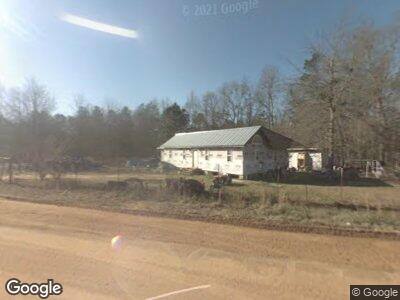
115 Doe Run Sylvania, GA 30467
Estimated Value: $67,872 - $217,000
2
Beds
2
Baths
910
Sq Ft
$146/Sq Ft
Est. Value
About This Home
This home is located at 115 Doe Run, Sylvania, GA 30467 and is currently estimated at $132,718, approximately $145 per square foot. 115 Doe Run is a home with nearby schools including Screven County Elementary School, Screven County Middle School, and Screven County High School.
Ownership History
Date
Name
Owned For
Owner Type
Purchase Details
Closed on
Mar 14, 2019
Sold by
Hickory Bluff Point Inc
Bought by
Hickory Bluff Ventures Llc
Current Estimated Value
Home Financials for this Owner
Home Financials are based on the most recent Mortgage that was taken out on this home.
Original Mortgage
$32,500
Interest Rate
4.3%
Mortgage Type
Commercial
Purchase Details
Closed on
Oct 2, 2018
Sold by
Johns Tina Ray
Bought by
Hickory Bluff Point Inc
Purchase Details
Closed on
Dec 28, 2010
Sold by
Qnb
Bought by
Hickory Bluff Point Inc
Purchase Details
Closed on
May 2, 2003
Sold by
Ray Tina
Bought by
Johns Joseph Mark
Purchase Details
Closed on
May 14, 1997
Sold by
Hickory Bluff Point
Bought by
Ray Tina
Purchase Details
Closed on
Oct 1, 1996
Sold by
Davis Jimmy C
Bought by
Hickory Bluff Point
Purchase Details
Closed on
Aug 25, 1995
Bought by
Davis Jimmy C
Create a Home Valuation Report for This Property
The Home Valuation Report is an in-depth analysis detailing your home's value as well as a comparison with similar homes in the area
Home Values in the Area
Average Home Value in this Area
Purchase History
| Date | Buyer | Sale Price | Title Company |
|---|---|---|---|
| Hickory Bluff Ventures Llc | -- | -- | |
| Thomas William | $35,000 | -- | |
| Hickory Bluff Point Inc | -- | -- | |
| Hickory Bluff Point Inc | -- | -- | |
| Johns Joseph Mark | -- | -- | |
| Ray Tina | $17,000 | -- | |
| Hickory Bluff Point | -- | -- | |
| Davis Jimmy C | $17,000 | -- |
Source: Public Records
Mortgage History
| Date | Status | Borrower | Loan Amount |
|---|---|---|---|
| Open | Morris Thomas William | $111,500 | |
| Closed | Thomas William | $32,500 |
Source: Public Records
Tax History Compared to Growth
Tax History
| Year | Tax Paid | Tax Assessment Tax Assessment Total Assessment is a certain percentage of the fair market value that is determined by local assessors to be the total taxable value of land and additions on the property. | Land | Improvement |
|---|---|---|---|---|
| 2024 | $236 | $8,708 | $8,360 | $348 |
| 2023 | $344 | $11,434 | $8,360 | $3,074 |
| 2022 | $271 | $8,800 | $8,360 | $440 |
| 2021 | $504 | $12,120 | $8,360 | $3,760 |
| 2020 | $518 | $12,200 | $8,360 | $3,840 |
| 2019 | $535 | $12,760 | $8,360 | $4,400 |
| 2018 | $363 | $12,680 | $8,000 | $4,680 |
| 2017 | $370 | $12,908 | $8,000 | $4,908 |
| 2016 | $430 | $12,992 | $8,000 | $4,992 |
| 2015 | -- | $13,120 | $8,000 | $5,120 |
| 2014 | -- | $13,244 | $8,000 | $5,244 |
| 2013 | -- | $13,412 | $8,000 | $5,412 |
Source: Public Records
Map
Nearby Homes
- 0 Effingham Hwy Unit 10486004
- 0 Effingham Hwy Unit 328090
- 4192 Halcyondale Rd
- 2625 Old Mill Way
- 175 Lane Rd
- 2109 W Waters Ln
- 0 R L Lee Rd Unit 5
- 0 Union Church Rd Unit 326876
- 1551 Buster Miller Rd
- 504 Heatherwood Dr
- 0 Arnett School Rd Unit 329850
- 0 Arnett School Rd Unit 10507610
- 2125 Busby Rd
- 0 N Highway 301 Unit 4 10480552
- 0 N Highway 301 Unit 3 10445176
- 0 N Highway 301 Unit 2 10445136
- 0 N Highway 301 Unit 10439137
- 0 Busby Rd Unit 10479601
- 296 Cameron Rd
- 0 Oliver Hwy Unit 10513523
- 115 Doe Run
- 1328 Dorsey Clark Rd
- 133 Quail Ridge Rd
- 131 Quail Ridge Rd
- 129 Quail Ridge Rd
- 114 Doe Run
- 112 Doe Run
- 0 Quail Ridge Rd Unit 7330990
- 0 Quail Ridge Rd Unit 8733008
- 0 Quail Ridge Rd Unit 8701484
- 0 Quail Ridge Rd Unit 7136747
- 0 Quail Ridge Rd Unit 3000406
- 0 Quail Ridge Rd
- 106 Doe Run
- 1295 Dorsey Clark Rd
- 1255 Dorsey Clark Rd
- 110 Quail Ridge Rd
- 0 Pheasant Ln Unit 8065136
- 0 Pheasant Ln Unit 8065115
- 0 Pheasant Ln