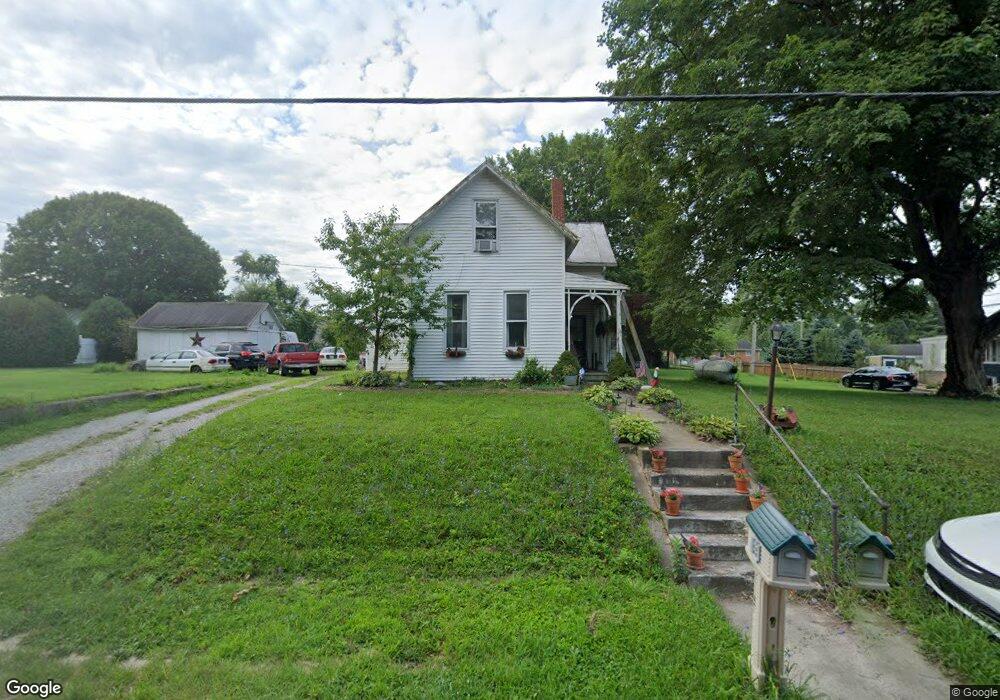
115 E Main St Fletcher, OH 45326
Estimated Value: $130,000 - $220,000
4
Beds
1
Bath
2,059
Sq Ft
$79/Sq Ft
Est. Value
About This Home
This home is located at 115 E Main St, Fletcher, OH 45326 and is currently estimated at $162,943, approximately $79 per square foot. 115 E Main St is a home located in Miami County with nearby schools including Miami East Elementary School, Miami East Junior High School, and Miami East High School.
Ownership History
Date
Name
Owned For
Owner Type
Purchase Details
Closed on
Mar 20, 2014
Sold by
Rowley Jamie P and Rowley Theresa E
Bought by
Wade Andrew G and Wade Amy L
Current Estimated Value
Purchase Details
Closed on
Mar 6, 2012
Sold by
Fannie Mae
Bought by
Rowley Jamie P
Purchase Details
Closed on
Nov 4, 2011
Sold by
Imhof Mark and Imhoff Mark
Bought by
Federal National Mortgage Association
Purchase Details
Closed on
Oct 6, 2006
Sold by
Hardman Martin W and Hoektra Candis J
Bought by
Imhoff Mark
Home Financials for this Owner
Home Financials are based on the most recent Mortgage that was taken out on this home.
Original Mortgage
$63,900
Interest Rate
6.49%
Mortgage Type
New Conventional
Purchase Details
Closed on
Mar 15, 2002
Sold by
Hardman Wayne E
Bought by
Hardman Martin W and Hoekstra Candis J
Purchase Details
Closed on
Jan 1, 1990
Bought by
Hardman Wayne E
Create a Home Valuation Report for This Property
The Home Valuation Report is an in-depth analysis detailing your home's value as well as a comparison with similar homes in the area
Purchase History
| Date | Buyer | Sale Price | Title Company |
|---|---|---|---|
| Wade Andrew G | $18,100 | Attorney | |
| Rowley Jamie P | $17,500 | -- | |
| Federal National Mortgage Association | $50,000 | -- | |
| Imhoff Mark | $79,900 | -- | |
| Hardman Martin W | -- | -- | |
| Hardman Wayne E | -- | -- |
Source: Public Records
Mortgage History
| Date | Status | Borrower | Loan Amount |
|---|---|---|---|
| Previous Owner | Hardman Martin W | $63,900 |
Source: Public Records
Tax History
| Year | Tax Paid | Tax Assessment Tax Assessment Total Assessment is a certain percentage of the fair market value that is determined by local assessors to be the total taxable value of land and additions on the property. | Land | Improvement |
|---|---|---|---|---|
| 2024 | $2,939 | $25,170 | $8,230 | $16,940 |
| 2023 | $2,527 | $25,170 | $8,230 | $16,940 |
| 2022 | $2,557 | $25,170 | $8,230 | $16,940 |
| 2021 | $1,630 | $20,970 | $6,860 | $14,110 |
| 2020 | $2,136 | $20,970 | $6,860 | $14,110 |
| 2019 | $1,547 | $20,970 | $6,860 | $14,110 |
| 2018 | $1,041 | $19,010 | $6,790 | $12,220 |
| 2017 | $1,034 | $19,010 | $6,790 | $12,220 |
| 2016 | $989 | $19,010 | $6,790 | $12,220 |
| 2015 | $1,003 | $18,310 | $6,550 | $11,760 |
| 2014 | $1,003 | $18,310 | $6,550 | $11,760 |
| 2013 | $1,043 | $19,180 | $7,420 | $11,760 |
Source: Public Records
Map
Nearby Homes
- 0 3rd St
- 10568 N Casstown Sidney Rd
- 8528 U S 36
- 7710 N Bollinger Rd
- 4845 E Troy Urbana Rd
- 7210 N Bollinger Rd
- 2920 Hoying Dr
- 2912 Hoying Dr
- 6915 Troy-Sidney Rd
- 4284 Deweese Rd
- 4505 N Alcony Conover Rd
- 3413 Ottawa Cir
- 3409 Ottawa Cir
- Tract 1 (of 5) N Bollinger Rd
- 3220 Cherokee Dr
- 2199 Bulle Rd
- 2332 Kiowa Ct
- 3005 Seminole Way
- 00 N Co Road 25a
- 1034 Eleanor Ave
Your Personal Tour Guide
Ask me questions while you tour the home.