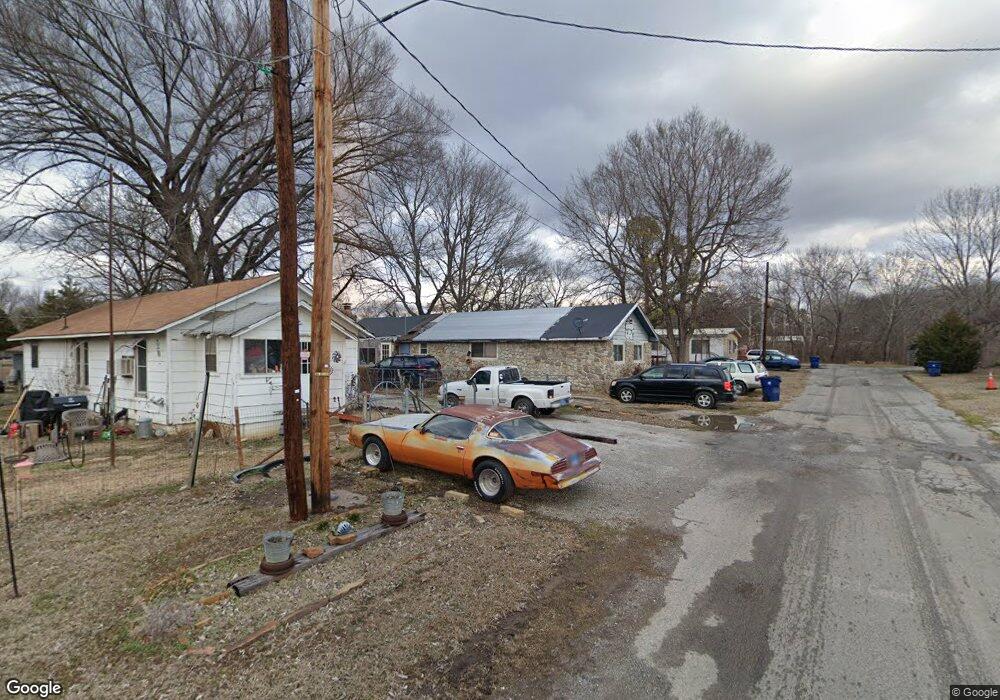
115 E Walnut Ave Barnsdall, OK 74002
Estimated Value: $30,048 - $122,000
3
Beds
2
Baths
2,018
Sq Ft
$39/Sq Ft
Est. Value
About This Home
This home is located at 115 E Walnut Ave, Barnsdall, OK 74002 and is currently estimated at $78,012, approximately $38 per square foot. 115 E Walnut Ave is a home located in Osage County with nearby schools including Barnsdall Elementary School and Barnsdall High School.
Ownership History
Date
Name
Owned For
Owner Type
Purchase Details
Closed on
May 15, 2006
Sold by
Serl Beatrice K and Serl Jack
Bought by
Ramsey Landon and Ramsey Becky
Current Estimated Value
Home Financials for this Owner
Home Financials are based on the most recent Mortgage that was taken out on this home.
Original Mortgage
$13,000
Outstanding Balance
$7,447
Interest Rate
6.4%
Mortgage Type
Unknown
Estimated Equity
$70,565
Purchase Details
Closed on
May 13, 2006
Sold by
Hailey Willis Dewayne and Hailey Lindsey Dawn
Bought by
Coffman Serl Beatrice K and Coffman Serl
Home Financials for this Owner
Home Financials are based on the most recent Mortgage that was taken out on this home.
Original Mortgage
$13,000
Outstanding Balance
$7,447
Interest Rate
6.4%
Mortgage Type
Unknown
Estimated Equity
$70,565
Purchase Details
Closed on
Apr 22, 2003
Sold by
Coffman Beatrice K
Bought by
Coffman Beatrice Kay
Purchase Details
Closed on
Dec 30, 1992
Sold by
Osage Fed Savings & Loan Assoc
Bought by
Coffman Raymond and Coffman Beatrice
Create a Home Valuation Report for This Property
The Home Valuation Report is an in-depth analysis detailing your home's value as well as a comparison with similar homes in the area
Purchase History
| Date | Buyer | Sale Price | Title Company |
|---|---|---|---|
| Ramsey Landon | $28,000 | -- | |
| Coffman Serl Beatrice K | -- | -- | |
| Coffman Beatrice Kay | -- | -- | |
| Coffman Raymond | $15,000 | -- |
Source: Public Records
Mortgage History
| Date | Status | Borrower | Loan Amount |
|---|---|---|---|
| Open | Ramsey Landon | $13,000 |
Source: Public Records
Tax History
| Year | Tax Paid | Tax Assessment Tax Assessment Total Assessment is a certain percentage of the fair market value that is determined by local assessors to be the total taxable value of land and additions on the property. | Land | Improvement |
|---|---|---|---|---|
| 2025 | $14 | $144 | $144 | $0 |
| 2024 | $13 | $144 | $144 | $0 |
| 2023 | $752 | $8,114 | $144 | $7,970 |
| 2022 | $660 | $8,114 | $144 | $7,970 |
| 2021 | $665 | $8,114 | $144 | $7,970 |
| 2020 | $331 | $4,666 | $144 | $4,522 |
| 2019 | $342 | $4,530 | $144 | $4,386 |
| 2018 | $287 | $4,398 | $144 | $4,254 |
| 2017 | $277 | $4,270 | $144 | $4,126 |
| 2016 | $263 | $4,146 | $144 | $4,002 |
| 2015 | $251 | $4,025 | $144 | $3,881 |
| 2014 | -- | $3,908 | $144 | $3,764 |
| 2013 | $323 | $3,794 | $144 | $3,650 |
Source: Public Records
Map
Nearby Homes
- 3306 2401 Rd
- 7365 Cr 2420
- 116 7th St
- 123 7th St
- 22 2280
- 920 W Main St
- 28 County Road 2280
- 27 County Road 2280
- 164 County Road 2280
- 161 County Road 2280
- 9 County Road 2280
- 11 County Road 2280
- 219 County Road 2280
- 523 County Road 2280
- 8 County Road 2280
- 18 County Road 2280
- 3306 County Road 2401
- 0000 County Road 2561
- 1569 County Road 2561
- Cox Farm
- 110 E Walnut Ave
- 110 W Walnut Ave
- 118 E Walnut Ave
- 105 E Walnut Ave
- 401 S 1st St
- 407 1st St
- 110 E Vine Ave
- 407 S 1st St
- 116 E Vine Ave
- 124 E Vine Ave
- 409 S 1st St
- 101 W Walnut Ave
- 103 W Vine Ave
- 111 E Vine Ave
- 108 W Walnut Ave
- 125 E Vine Ave
- 415 S 1st St
- 80 S 1st Rd
- 115 W Walnut Ave
- 116 W Chestnut Ave
Your Personal Tour Guide
Ask me questions while you tour the home.