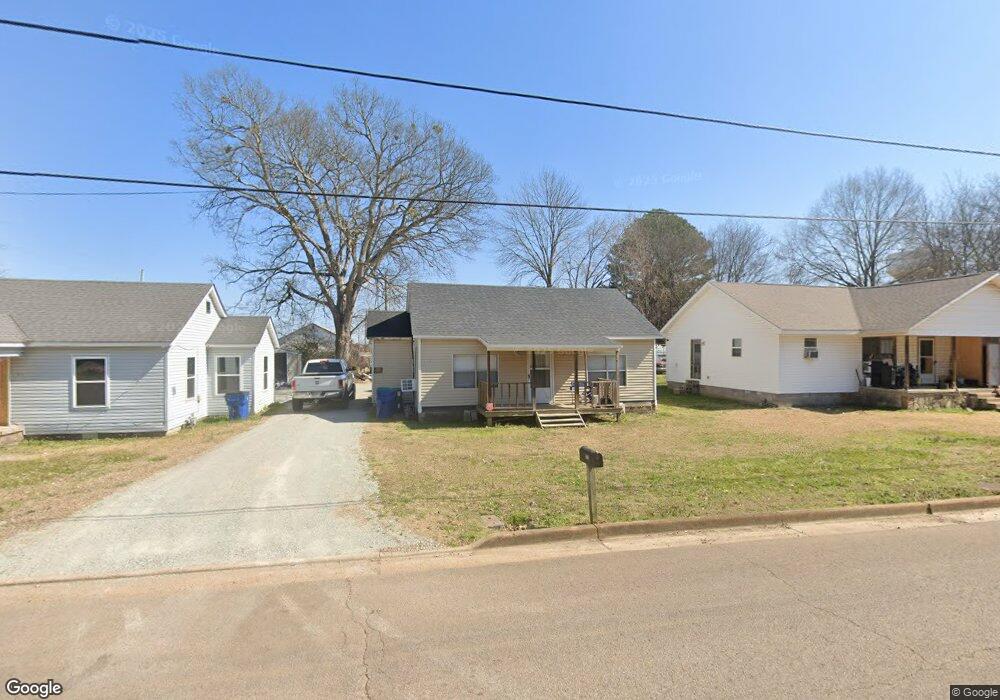
115 Fairground St Savannah, TN 38372
Estimated Value: $41,000 - $109,000
--
Bed
1
Bath
792
Sq Ft
$91/Sq Ft
Est. Value
About This Home
This home is located at 115 Fairground St, Savannah, TN 38372 and is currently estimated at $72,098, approximately $91 per square foot. 115 Fairground St is a home located in Hardin County with nearby schools including Hardin County High School, Hardin County Christian School, and Savannah Christian Academy.
Ownership History
Date
Name
Owned For
Owner Type
Purchase Details
Closed on
Oct 21, 2024
Sold by
Stricklin Charles
Bought by
Neill Robert A
Current Estimated Value
Home Financials for this Owner
Home Financials are based on the most recent Mortgage that was taken out on this home.
Original Mortgage
$182,400
Outstanding Balance
$15,645
Interest Rate
6.35%
Mortgage Type
Construction
Estimated Equity
$56,453
Purchase Details
Closed on
Feb 2, 2017
Sold by
Bullington Whitney M
Bought by
Stricklin Charles
Purchase Details
Closed on
Aug 10, 2011
Sold by
Brown Dennis
Bought by
Mims Whitney
Purchase Details
Closed on
Feb 27, 2004
Sold by
Melson Jerry
Bought by
Brown Dennis
Purchase Details
Closed on
Nov 13, 2003
Bought by
Brown Dennis
Purchase Details
Closed on
Oct 7, 1980
Bought by
Melson Edd R and Melson Louise
Purchase Details
Closed on
Mar 30, 1979
Create a Home Valuation Report for This Property
The Home Valuation Report is an in-depth analysis detailing your home's value as well as a comparison with similar homes in the area
Home Values in the Area
Average Home Value in this Area
Purchase History
| Date | Buyer | Sale Price | Title Company |
|---|---|---|---|
| Neill Robert A | $40,000 | None Listed On Document | |
| Stricklin Charles | $5,200 | -- | |
| Mims Whitney | $8,000 | -- | |
| Brown Dennis | $8,000 | -- | |
| Brown Dennis | $8,000 | -- | |
| Melson Edd R | -- | -- | |
| -- | -- | -- |
Source: Public Records
Mortgage History
| Date | Status | Borrower | Loan Amount |
|---|---|---|---|
| Open | Neill Robert A | $182,400 |
Source: Public Records
Tax History Compared to Growth
Tax History
| Year | Tax Paid | Tax Assessment Tax Assessment Total Assessment is a certain percentage of the fair market value that is determined by local assessors to be the total taxable value of land and additions on the property. | Land | Improvement |
|---|---|---|---|---|
| 2024 | $193 | $7,875 | $1,500 | $6,375 |
| 2023 | $193 | $7,875 | $1,500 | $6,375 |
| 2022 | $146 | $5,300 | $1,300 | $4,000 |
| 2021 | $146 | $5,300 | $1,300 | $4,000 |
| 2020 | $146 | $5,300 | $1,300 | $4,000 |
| 2019 | $146 | $5,300 | $1,300 | $4,000 |
| 2018 | $143 | $5,300 | $1,300 | $4,000 |
| 2017 | $112 | $4,050 | $850 | $3,200 |
| 2016 | $112 | $4,050 | $850 | $3,200 |
| 2015 | $102 | $4,050 | $850 | $3,200 |
| 2014 | $102 | $4,050 | $850 | $3,200 |
Source: Public Records
Map
Nearby Homes
- 10 Deberry St
- 171 White St
- 230 White St
- 00 Enoch Blvd
- 13305 U S Highway 64
- 105 Pinhook Dr
- 530 Main St E
- 25 Northcutt St
- 65 Davis St
- 80 Quartet Cir
- 417 Tennessee St
- 375 Tennessee St
- 45 Oak St
- 190 Turner Kyle Dr
- 710 Main St E
- 80 Northcutt St
- 0 Hwy 128 Hwy Unit LotWP001 22873478
- 0 Hwy 128 Hwy Unit RTC2801964
- 0 Hwy 128 Hwy Unit 10143254
- 300 Patterson Rd
- 105 Fairground St
- 155 Beech St
- 140 Fairground St
- 130 Fairground St
- 160 Fairground St
- 95 Sugar Maple Ave
- 165 Birch St
- 85 Fairground St
- 80 Sugar Maple Ave
- 80 Fairground St
- 0 Jackson St Unit 3190441
- 175 Fairground St
- 65 Fairground St
- 75 Sugar Maple Ave
- 70 Fairground St
- 150 Birch St
- 160 Birch St
- 70 Jackson St
- 180 Birch St
- 15 Deberry St