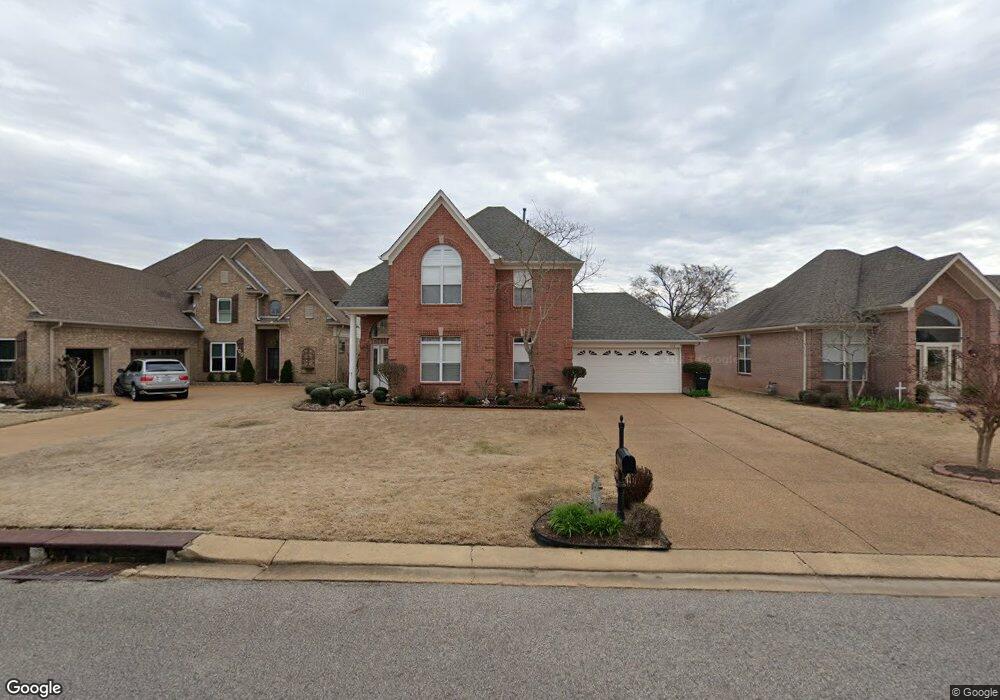
115 Fairoaks Dr Oakland, TN 38060
Estimated Value: $380,000 - $400,000
--
Bed
3
Baths
2,514
Sq Ft
$156/Sq Ft
Est. Value
About This Home
This home is located at 115 Fairoaks Dr, Oakland, TN 38060 and is currently estimated at $392,743, approximately $156 per square foot. 115 Fairoaks Dr is a home located in Fayette County with nearby schools including Oakland Elementary School, West Junior High School, and Fayette Ware Comprehensive High School.
Ownership History
Date
Name
Owned For
Owner Type
Purchase Details
Closed on
Nov 15, 2006
Sold by
Johnson William S
Bought by
Hardin Everett
Current Estimated Value
Home Financials for this Owner
Home Financials are based on the most recent Mortgage that was taken out on this home.
Original Mortgage
$182,400
Outstanding Balance
$102,914
Interest Rate
6.25%
Mortgage Type
New Conventional
Estimated Equity
$289,829
Purchase Details
Closed on
Jan 23, 2006
Sold by
Michael Lewis T
Bought by
Vintage Homes Llc
Purchase Details
Closed on
Sep 12, 2003
Sold by
Security Builders
Bought by
Johnson William S
Home Financials for this Owner
Home Financials are based on the most recent Mortgage that was taken out on this home.
Original Mortgage
$145,000
Interest Rate
5.42%
Purchase Details
Closed on
Jun 17, 2002
Sold by
Fairoaks Properties
Bought by
Security Builders
Home Financials for this Owner
Home Financials are based on the most recent Mortgage that was taken out on this home.
Original Mortgage
$180,220
Interest Rate
6.86%
Create a Home Valuation Report for This Property
The Home Valuation Report is an in-depth analysis detailing your home's value as well as a comparison with similar homes in the area
Home Values in the Area
Average Home Value in this Area
Purchase History
| Date | Buyer | Sale Price | Title Company |
|---|---|---|---|
| Hardin Everett | $228,200 | -- | |
| Hardin Everett | $228,200 | -- | |
| Vintage Homes Llc | $41,253 | -- | |
| Johnson William S | $205,000 | -- | |
| Security Builders | $42,500 | -- |
Source: Public Records
Mortgage History
| Date | Status | Borrower | Loan Amount |
|---|---|---|---|
| Open | Hardin Everett | $182,400 | |
| Previous Owner | Security Builders | $145,000 | |
| Previous Owner | Security Builders | $180,220 |
Source: Public Records
Tax History Compared to Growth
Tax History
| Year | Tax Paid | Tax Assessment Tax Assessment Total Assessment is a certain percentage of the fair market value that is determined by local assessors to be the total taxable value of land and additions on the property. | Land | Improvement |
|---|---|---|---|---|
| 2024 | $1,832 | $70,925 | $12,500 | $58,425 |
| 2023 | $1,832 | $70,925 | $0 | $0 |
| 2022 | $1,215 | $70,925 | $12,500 | $58,425 |
| 2021 | $1,215 | $70,925 | $12,500 | $58,425 |
| 2020 | $837 | $70,925 | $12,500 | $58,425 |
| 2019 | $1,127 | $55,525 | $11,250 | $44,275 |
| 2018 | $1,159 | $55,525 | $11,250 | $44,275 |
| 2017 | $979 | $55,075 | $11,250 | $43,825 |
| 2016 | $979 | $51,425 | $11,250 | $40,175 |
| 2015 | $979 | $51,425 | $11,250 | $40,175 |
| 2014 | $979 | $51,425 | $11,250 | $40,175 |
Source: Public Records
Map
Nearby Homes
- 235 Fairoaks Dr
- 65 Bentgrass Cove
- 160 Aberdeen Dr
- 217 Saint Andrews Dr Unit 55-C
- Callahan Plan at Fair Oaks - Villas at Fair Oaks
- Clark Plan at Fair Oaks - Villas at Fair Oaks
- Gibson Plan at Fair Oaks - Villas at Fair Oaks
- 325 Saint Andrews Dr
- 175 Saint Andrews Dr
- 205 Saint Andrews Dr
- 230 Driftwood Loop
- 360 Saint Andrews Dr
- 290 Saint Andrews Dr
- 300 Saint Andrews Dr
- 65 Birkdale Dr
- 22 Doral Loop
- 100 Pine Valley Dr
- 255 Highland Park Cove
- 305 Driftwood Loop
- Carlisle Plan at Fairway Vilage - Fairway Village
- 125 Fairoaks Dr
- 120 Fairoaks Dr
- 135 Fairoaks Dr
- 95 Fairoaks Dr
- 100 Fairoaks Dr
- 140 Fairoaks Dr
- 90 Fairoaks Dr
- 85 Fairoaks Dr
- 150 Fairoaks Dr
- 155 Fairoaks Dr
- 70 Fairoaks Dr
- 160 Fairoaks Dr
- 165 Fairoaks Dr
- 65 Fairoaks Dr
- 170 Fairoaks Dr
- 60 Fairoaks Dr
- 175 Fairoaks Dr
- 55 Fairoaks Dr
- 180 Fairoaks Dr
- 185 Fairoaks Dr