115 Flintwell Ct San Jose, CA 95138
Silver Leaf NeighborhoodEstimated Value: $1,337,273 - $1,540,000
About This Home
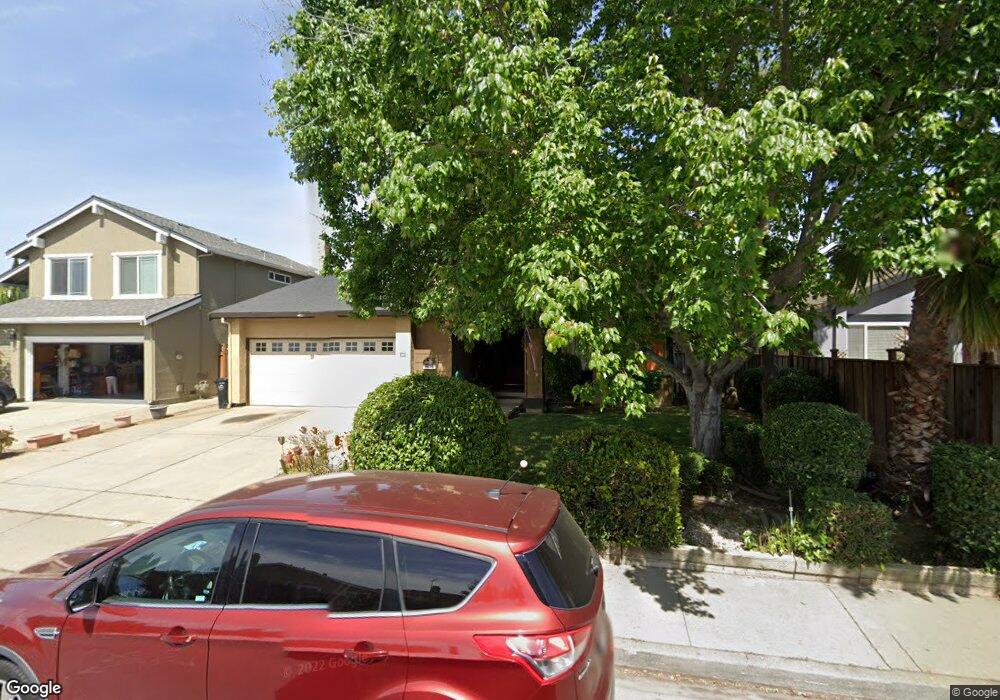
This home is located at 115 Flintwell Ct, San Jose, CA 95138 and is currently estimated at $1,412,318, approximately $679 per square foot. 115 Flintwell Ct is a home located in Santa Clara County with nearby schools including Baldwin (Julia) Elementary School, Bernal Intermediate School, and Oak Grove High School.
Ownership History
We collect this data history from publicly available records. To have your information removed, we recommend requesting removal directly through your county’s website.
Purchase Details
Purchase Details
Home Financials for this Owner
Home Financials are based on the most recent Mortgage that was taken out on this home.Home Values in the Area
Average Home Value in this Area
Purchase History
We collect this data history from publicly available records. To have your information removed, we recommend requesting removal directly through your county’s website.
| Date | Buyer | Sale Price | Title Company |
|---|---|---|---|
| -- | None Available | ||
| -- | None Available | ||
| -- | Chicago Title Co |
Mortgage History
We collect this data history from publicly available records. To have your information removed, we recommend requesting removal directly through your county’s website.
| Date | Status | Borrower | Loan Amount |
|---|---|---|---|
| Closed | $104,500 |
Tax History
We collect this data history from publicly available records. To have your information removed, we recommend requesting removal directly through your county’s website.
| Year | Tax Paid | Tax Assessment Tax Assessment Total Assessment is a certain percentage of the fair market value that is determined by local assessors to be the total taxable value of land and additions on the property. | Land | Improvement |
|---|---|---|---|---|
| 2025 | $3,806 | $182,423 | $45,275 | $137,148 |
| 2024 | $3,806 | $178,847 | $44,388 | $134,459 |
| 2023 | $3,707 | $175,341 | $43,518 | $131,823 |
| 2022 | $3,674 | $171,904 | $42,665 | $129,239 |
| 2021 | $3,563 | $168,534 | $41,829 | $126,705 |
| 2020 | $3,445 | $166,807 | $41,401 | $125,406 |
| 2019 | $3,345 | $163,538 | $40,590 | $122,948 |
| 2018 | $3,300 | $160,333 | $39,795 | $120,538 |
| 2017 | $3,248 | $157,190 | $39,015 | $118,175 |
| 2016 | $3,092 | $154,108 | $38,250 | $115,858 |
| 2015 | $3,022 | $151,794 | $37,676 | $114,118 |
| 2014 | $2,530 | $148,821 | $36,938 | $111,883 |
Map
- 6709 Magnetic Loop
- 428 Whistler Place
- 446 Ellicott Loop
- 65 Southport Ct
- 439 Ellicott Loop
- 66 Southport Ct
- 6761 Quantum Loop
- 5941 Virtual Ct
- 6785 Optimum Loop
- 614 Willow Bend Ct
- 41 Tennant Ave
- 5954 Larkstone Loop
- 5977 Larkstone Loop
- 5506 Century Park Way
- 6099 Charlotte Dr
- 6013 Black Onyx Ct
- 815 Blue Opal Dr
- 6121 Lambeck Ln Unit 972
- 5925 Charlotte Dr Unit 413
- 5951 Sunstone Dr Unit 312
- 123 Flintwell Ct
- 107 Flintwell Ct
- 110 Casswell Ct
- 131 Flintwell Ct
- 116 Casswell Ct
- 104 Casswell Ct
- 5705 Silver Leaf Rd
- 122 Casswell Ct
- 124 Flintwell Ct
- 99 Flintwell Way
- 139 Flintwell Ct
- 128 Casswell Ct
- 5709 Silver Leaf Rd
- 132 Flintwell Ct
- 5692 Silver Leaf Rd
- 98 Flintwell Way
- 5679 Silver Leaf Rd
- 95 Flintwell Way
- 147 Flintwell Ct
- 5688 Silver Leaf Rd
Ask me questions while you tour the home.