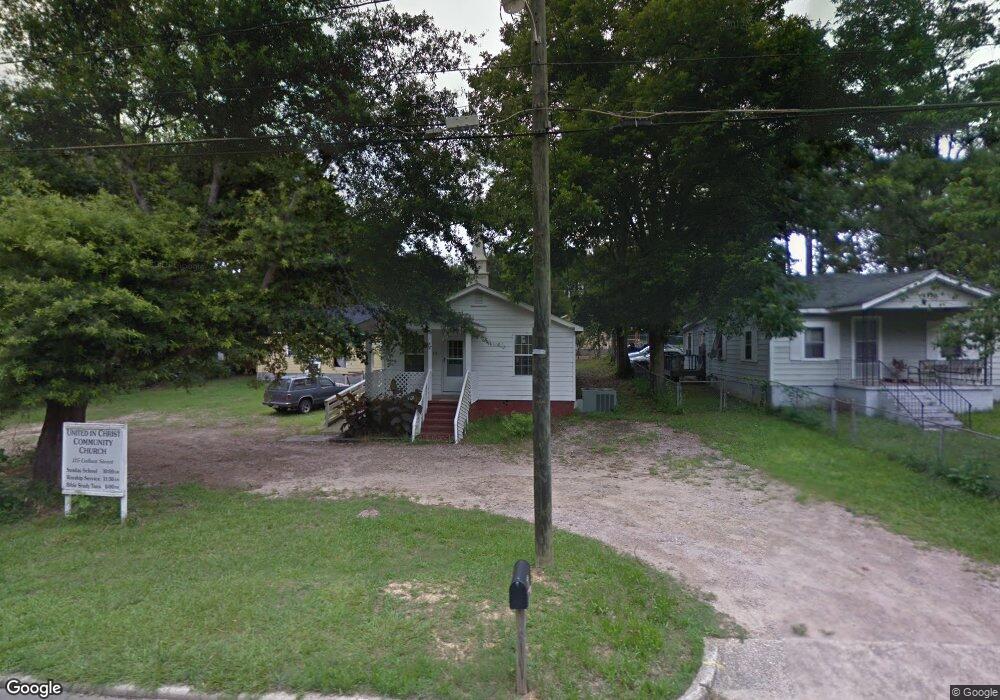
115 Gallant St Lagrange, GA 30241
Estimated Value: $104,000 - $175,000
3
Beds
2
Baths
2,496
Sq Ft
$62/Sq Ft
Est. Value
About This Home
This home is located at 115 Gallant St, Lagrange, GA 30241 and is currently estimated at $155,599, approximately $62 per square foot. 115 Gallant St is a home located in Troup County with nearby schools including Hollis Hand Elementary School, Franklin Forest Elementary School, and Ethel W. Kight Elementary School.
Ownership History
Date
Name
Owned For
Owner Type
Purchase Details
Closed on
Sep 29, 2005
Sold by
Boillat Macon Madeline Car
Bought by
Wren James
Current Estimated Value
Purchase Details
Closed on
Feb 3, 2004
Sold by
Ty Stribling
Bought by
Bolliat-Macon Madeline Carol
Purchase Details
Closed on
Feb 2, 2004
Sold by
Ty Stribling
Bought by
Ty Stribling
Purchase Details
Closed on
Oct 13, 2003
Sold by
Martin J Miller
Bought by
Ty Stribling
Purchase Details
Closed on
Mar 1, 2001
Sold by
Madeline Moore Tucker
Bought by
Martin J Miller
Purchase Details
Closed on
Jul 6, 1992
Sold by
Morrow Bobby R and Morrow Patricia A
Bought by
Madeline Moore Tucker
Purchase Details
Closed on
Mar 10, 1983
Sold by
Moore Madeline
Bought by
Morrow Bobby R and Morrow Patricia A
Purchase Details
Closed on
Oct 8, 1981
Sold by
Commercial Bank & Trust Co
Bought by
Moore Madeline
Purchase Details
Closed on
Jul 22, 1977
Sold by
Gallant James G
Bought by
Commercial Bank & Trust Co
Create a Home Valuation Report for This Property
The Home Valuation Report is an in-depth analysis detailing your home's value as well as a comparison with similar homes in the area
Purchase History
| Date | Buyer | Sale Price | Title Company |
|---|---|---|---|
| Wren James | $28,000 | -- | |
| Bolliat-Macon Madeline Carol | -- | -- | |
| Ty Stribling | $36,000 | -- | |
| Ty Stribling | $1,181,000 | -- | |
| Martin J Miller | $907,500 | -- | |
| Madeline Moore Tucker | -- | -- | |
| Morrow Bobby R | $3,500 | -- | |
| Moore Madeline | $7,500 | -- | |
| Commercial Bank & Trust Co | -- | -- |
Source: Public Records
Tax History
| Year | Tax Paid | Tax Assessment Tax Assessment Total Assessment is a certain percentage of the fair market value that is determined by local assessors to be the total taxable value of land and additions on the property. | Land | Improvement |
|---|---|---|---|---|
| 2025 | -- | $48,800 | $2,480 | $46,320 |
| 2024 | -- | $48,000 | $2,480 | $45,520 |
| 2023 | $0 | $44,600 | $2,480 | $42,120 |
| 2022 | $1,095 | $39,240 | $2,480 | $36,760 |
| 2021 | $1,150 | $38,120 | $1,240 | $36,880 |
| 2020 | $1,150 | $38,120 | $1,240 | $36,880 |
| 2019 | $1,115 | $36,960 | $1,240 | $35,720 |
| 2018 | $0 | $36,960 | $1,240 | $35,720 |
| 2017 | $1,115 | $36,960 | $1,240 | $35,720 |
| 2016 | $0 | $38,916 | $1,258 | $37,658 |
| 2015 | -- | $38,916 | $1,258 | $37,658 |
| 2014 | -- | $38,898 | $1,240 | $37,658 |
| 2013 | -- | $41,831 | $1,240 | $40,591 |
Source: Public Records
Map
Nearby Homes
- 117 Gallant St
- 111 Gallant St
- 230 E Render St
- 226 E Render St
- 109 Gallant St
- 114 Gallant St
- 116 Gallant St
- 224 E Render St
- 118 Gallant St
- 107 Gallant St
- 120 Gallant St
- 222 E Render St
- 236 E Render St
- 108 Gallant St
- 605 E Render St
- 223 E Render St
- 105 Gallant St
- 220 E Render St
- 103 Belk St
- 103 Belk St Unit 48
Your Personal Tour Guide
Ask me questions while you tour the home.