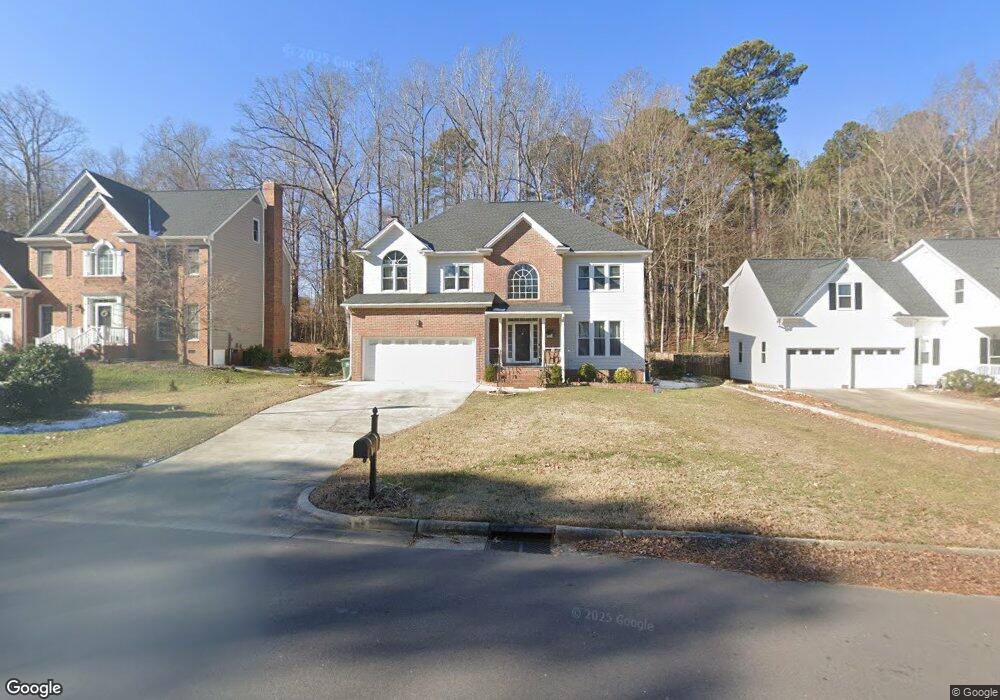
115 Glenmore Rd Cary, NC 27519
West Cary NeighborhoodEstimated Value: $668,000 - $715,000
3
Beds
3
Baths
2,459
Sq Ft
$284/Sq Ft
Est. Value
About This Home
This home is located at 115 Glenmore Rd, Cary, NC 27519 and is currently estimated at $699,205, approximately $284 per square foot. 115 Glenmore Rd is a home located in Wake County with nearby schools including Highcroft Elementary, Mills Park Middle School, and Green Level High School.
Ownership History
Date
Name
Owned For
Owner Type
Purchase Details
Closed on
Nov 26, 2007
Sold by
Reynolds Michael J and Beach Carrie Lee
Bought by
Macmullen Wesley and Macmullen Ana
Current Estimated Value
Home Financials for this Owner
Home Financials are based on the most recent Mortgage that was taken out on this home.
Original Mortgage
$326,428
Outstanding Balance
$207,256
Interest Rate
6.36%
Mortgage Type
VA
Estimated Equity
$491,949
Purchase Details
Closed on
Apr 4, 2006
Sold by
Berg Daniel C and Berg Michelle J
Bought by
Reynolds Michael J
Home Financials for this Owner
Home Financials are based on the most recent Mortgage that was taken out on this home.
Original Mortgage
$246,000
Interest Rate
6.25%
Mortgage Type
Purchase Money Mortgage
Purchase Details
Closed on
Apr 19, 1999
Sold by
Pannkuk Construction Inc
Bought by
Berg Daniel C and Berg Michelle J
Home Financials for this Owner
Home Financials are based on the most recent Mortgage that was taken out on this home.
Original Mortgage
$187,920
Interest Rate
7.06%
Purchase Details
Closed on
Apr 24, 1998
Sold by
W & W Partners Inc
Bought by
Pannkuk Construction Inc
Create a Home Valuation Report for This Property
The Home Valuation Report is an in-depth analysis detailing your home's value as well as a comparison with similar homes in the area
Home Values in the Area
Average Home Value in this Area
Purchase History
| Date | Buyer | Sale Price | Title Company |
|---|---|---|---|
| Macmullen Wesley | $316,000 | None Available | |
| Reynolds Michael J | $307,500 | None Available | |
| Berg Daniel C | $235,000 | -- | |
| Pannkuk Construction Inc | $84,000 | -- |
Source: Public Records
Mortgage History
| Date | Status | Borrower | Loan Amount |
|---|---|---|---|
| Open | Macmullen Wesley | $326,428 | |
| Previous Owner | Reynolds Michael J | $246,000 | |
| Previous Owner | Berg Daniel C | $187,920 |
Source: Public Records
Tax History Compared to Growth
Tax History
| Year | Tax Paid | Tax Assessment Tax Assessment Total Assessment is a certain percentage of the fair market value that is determined by local assessors to be the total taxable value of land and additions on the property. | Land | Improvement |
|---|---|---|---|---|
| 2025 | $5,578 | $648,515 | $240,000 | $408,515 |
| 2024 | $5,458 | $648,515 | $240,000 | $408,515 |
| 2023 | $3,920 | $389,246 | $86,000 | $303,246 |
| 2022 | $3,774 | $389,246 | $86,000 | $303,246 |
| 2021 | $3,698 | $389,246 | $86,000 | $303,246 |
| 2020 | $3,706 | $387,969 | $86,000 | $301,969 |
| 2019 | $3,467 | $321,955 | $86,000 | $235,955 |
| 2018 | $3,254 | $321,955 | $86,000 | $235,955 |
| 2017 | $3,127 | $321,955 | $86,000 | $235,955 |
| 2016 | $3,080 | $321,955 | $86,000 | $235,955 |
| 2015 | $3,213 | $324,301 | $86,000 | $238,301 |
| 2014 | $3,030 | $324,301 | $86,000 | $238,301 |
Source: Public Records
Map
Nearby Homes
- 108 Ferncroft Ct
- 102 W Hill Dr
- 206 Highfield Ave
- 302 Caraway Ln
- 224 Birdsgrove Ct
- 205 Caniff Ln
- 437 Henmore Brook Dr
- 203 Caraway Ln
- 440 Creekhurst Place
- 322 Parkmeadow Dr
- 210 Lindemans Dr
- 306 Parkknoll Ln
- 209 Parkmeadow Dr
- 313 Alliance Cir
- 5001 Sears Farm Rd
- 410 Widdington Ln
- 921 Lemster Ln
- 702 Unison Ct
- 1203 Corkery Ridge Ct
- 424 Euphoria Cir
- 113 Glenmore Rd
- 117 Glenmore Rd
- 111 Glenmore Rd
- 119 Glenmore Rd
- 110 Glenmore Rd
- 108 Glenmore Rd
- 109 Glenmore Rd
- 114 Glenmore Rd
- 121 Glenmore Rd
- 6808 Branton Dr
- 107 Rockland Cir
- 106 Glenmore Rd
- 109 Rockland Cir
- 116 Glenmore Rd
- 107 Glenmore Rd
- 6804 Branton Dr
- 6804 Branton Dr Unit 1
- 111 Ferncroft Ct
- 105 Rockland Cir
- 6816 Branton Dr