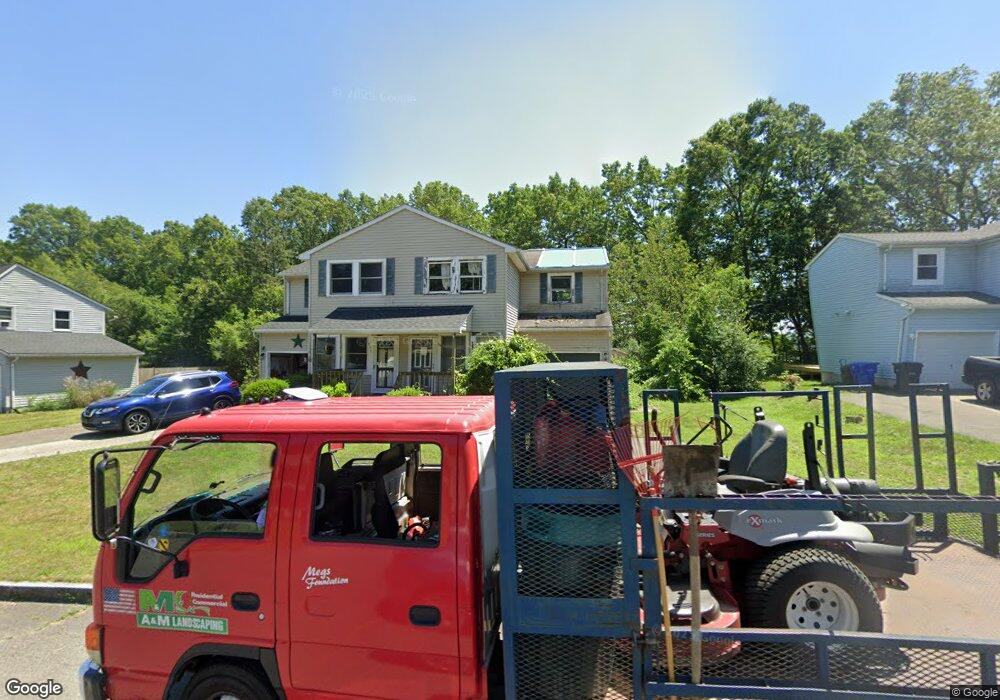
115 Glenmore St Springfield, MA 01129
Boston Road NeighborhoodEstimated Value: $225,358
3
Beds
2
Baths
1,236
Sq Ft
$182/Sq Ft
Est. Value
About This Home
This home is located at 115 Glenmore St, Springfield, MA 01129 and is currently estimated at $225,358, approximately $182 per square foot. 115 Glenmore St is a home located in Hampden County with nearby schools including Warner, John F. Kennedy Academy, and Roger L. Putnam Vocational Technical Academy.
Ownership History
Date
Name
Owned For
Owner Type
Purchase Details
Closed on
Nov 21, 2000
Sold by
Whiting Ann G
Bought by
Martins Carlos A
Current Estimated Value
Purchase Details
Closed on
Jun 29, 1993
Sold by
Marchand Constr Co
Bought by
Martins Carlos A
Home Financials for this Owner
Home Financials are based on the most recent Mortgage that was taken out on this home.
Original Mortgage
$42,400
Interest Rate
7.37%
Mortgage Type
Purchase Money Mortgage
Create a Home Valuation Report for This Property
The Home Valuation Report is an in-depth analysis detailing your home's value as well as a comparison with similar homes in the area
Home Values in the Area
Average Home Value in this Area
Purchase History
| Date | Buyer | Sale Price | Title Company |
|---|---|---|---|
| Martins Carlos A | $76,000 | -- | |
| Martins Carlos A | $76,000 | -- | |
| Martins Carlos A | $53,000 | -- |
Source: Public Records
Mortgage History
| Date | Status | Borrower | Loan Amount |
|---|---|---|---|
| Previous Owner | Martins Carlos A | $42,400 |
Source: Public Records
Tax History
| Year | Tax Paid | Tax Assessment Tax Assessment Total Assessment is a certain percentage of the fair market value that is determined by local assessors to be the total taxable value of land and additions on the property. | Land | Improvement |
|---|---|---|---|---|
| 2025 | $0 | $203,800 | $43,300 | $160,500 |
| 2024 | $0 | $175,800 | $40,500 | $135,300 |
| 2023 | $0 | $161,000 | $33,200 | $127,800 |
| 2022 | $2,697 | $143,300 | $31,000 | $112,300 |
| 2021 | $2,529 | $133,800 | $28,200 | $105,600 |
| 2020 | $2,392 | $122,500 | $35,000 | $87,500 |
| 2019 | $2,401 | $122,000 | $35,000 | $87,000 |
| 2018 | $2,364 | $120,100 | $35,000 | $85,100 |
| 2017 | $3,108 | $158,100 | $35,000 | $123,100 |
| 2016 | $2,790 | $141,900 | $35,000 | $106,900 |
| 2015 | $2,762 | $140,400 | $35,000 | $105,400 |
Source: Public Records
Map
Nearby Homes
- 121 Glenmore St
- 111 Glenmore St
- 123 Glenmore St
- 107 Glenmore St
- 101 Glenmore St
- 131 Glenmore St
- 112 Glenmore St
- 120 Glenmore St
- 93 Glenmore St
- 128 Glenmore St
- 106 Glenmore St
- 130 Glenmore St
- 104 Glenmore St
- 91 Glenmore St
- 91 Glenmore St Unit NO
- 98 Glenmore St
- 81 Glenmore St
- 138 Glenmore St
- 140 Glenmore St
- 94 Glenmore St
Your Personal Tour Guide
Ask me questions while you tour the home.