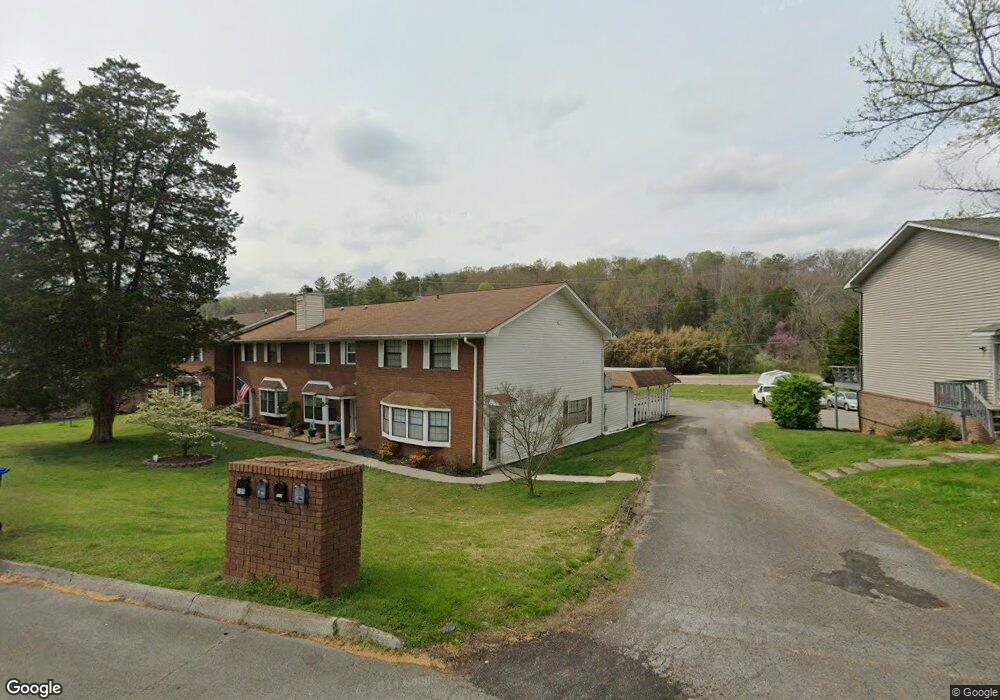
115 Golfcrest Ln Oak Ridge, TN 37830
Estimated Value: $183,348 - $245,000
3
Beds
3
Baths
1,536
Sq Ft
$137/Sq Ft
Est. Value
About This Home
This home is located at 115 Golfcrest Ln, Oak Ridge, TN 37830 and is currently estimated at $210,587, approximately $137 per square foot. 115 Golfcrest Ln is a home located in Roane County with nearby schools including Linden Elementary, Robertsville Middle School, and Oak Ridge High School.
Ownership History
Date
Name
Owned For
Owner Type
Purchase Details
Closed on
Apr 16, 2021
Sold by
Watson Larry Melvin and Watson Betty Jo
Bought by
Lee Watson Jason and Watson Julie A
Current Estimated Value
Home Financials for this Owner
Home Financials are based on the most recent Mortgage that was taken out on this home.
Original Mortgage
$104,500
Outstanding Balance
$94,351
Interest Rate
3%
Mortgage Type
New Conventional
Estimated Equity
$116,236
Purchase Details
Closed on
Feb 3, 1999
Sold by
Stumbo Philip I
Bought by
Larry Watson
Home Financials for this Owner
Home Financials are based on the most recent Mortgage that was taken out on this home.
Original Mortgage
$79,053
Interest Rate
6.85%
Purchase Details
Closed on
Feb 16, 1993
Bought by
Stumbo Philip I
Purchase Details
Closed on
Feb 16, 1987
Bought by
Stumbo Philip I and Stumbo Kaye S
Purchase Details
Closed on
Aug 20, 1981
Bought by
Stumbo Philip I and Stumbo Kaye S
Create a Home Valuation Report for This Property
The Home Valuation Report is an in-depth analysis detailing your home's value as well as a comparison with similar homes in the area
Home Values in the Area
Average Home Value in this Area
Purchase History
| Date | Buyer | Sale Price | Title Company |
|---|---|---|---|
| Lee Watson Jason | $110,000 | 7 Title | |
| Larry Watson | $88,000 | -- | |
| Stumbo Philip I | -- | -- | |
| Stumbo Philip I | -- | -- | |
| Stumbo Philip I | -- | -- |
Source: Public Records
Mortgage History
| Date | Status | Borrower | Loan Amount |
|---|---|---|---|
| Open | Lee Watson Jason | $104,500 | |
| Previous Owner | Stumbo Philip I | $79,053 |
Source: Public Records
Tax History Compared to Growth
Tax History
| Year | Tax Paid | Tax Assessment Tax Assessment Total Assessment is a certain percentage of the fair market value that is determined by local assessors to be the total taxable value of land and additions on the property. | Land | Improvement |
|---|---|---|---|---|
| 2024 | -- | $25,175 | $3,500 | $21,675 |
| 2023 | $1,171 | $25,175 | $3,500 | $21,675 |
| 2022 | $1,171 | $25,175 | $3,500 | $21,675 |
| 2021 | $1,156 | $25,175 | $3,500 | $21,675 |
| 2020 | $570 | $25,225 | $3,500 | $21,725 |
| 2019 | $1,129 | $22,550 | $3,500 | $19,050 |
| 2018 | $1,103 | $22,550 | $3,500 | $19,050 |
| 2017 | $1,098 | $22,550 | $3,500 | $19,050 |
| 2016 | $1,098 | $22,550 | $3,500 | $19,050 |
| 2015 | $530 | $22,550 | $3,500 | $19,050 |
| 2013 | -- | $24,275 | $3,425 | $20,850 |
Source: Public Records
Map
Nearby Homes
- 17 Westover Dr
- 194 Sweet Gum Ln
- 16 Forest Creek Pkwy
- 102 Norway Ln
- 107 Nebraska Ave
- 150 Glassboro Dr
- 0 Glassboro Dr
- 0 Gum Hollow Rd
- 154 Glassboro Dr
- 101 Newport Dr
- 137 Forest Creek Pkwy
- 1046 W Outer Dr
- 1070 W Outer Dr
- 1088 W Outer Dr
- 142 Forest Creek Pkwy
- 102 Greywood Place
- 118 Black Oak Dr
- 233 Gum Hollow Rd
- 120 Black Oak Dr
- 0 Lot 38 and 39 Black Oak Dr
- 113 Golfcrest Ln
- 117 Golfcrest Ln
- 111 Golfcrest Ln
- 119 Golfcrest Ln
- 121 Golfcrest Ln
- 109 Golfcrest Ln
- 101 Greenwood Ln
- 123 Golfcrest Ln
- 123 Golfcrest Ln Unit 12
- 107 Golfcrest Ln
- 102 Greenwood Ln
- 125 Golfcrest Ln
- 105 Golfcrest Ln
- 105 Greenwood Ln
- 127 Golfcrest Ln
- 4 Greenwood Ln Unit 109-115
- 103 Golfcrest Ln
- 103 Greenwood Ln
- 4 Golfcrest Ln Unit 143
- 4 Golfcrest Ln Unit 125,127,129,131