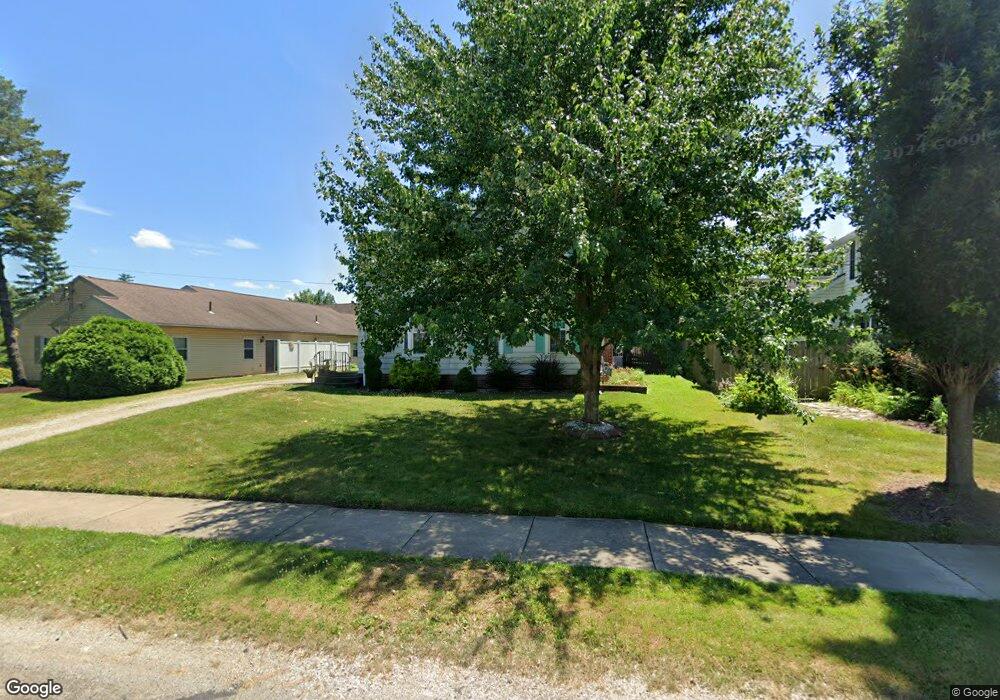
115 High St Ashland, OH 44805
Estimated Value: $267,000 - $318,000
4
Beds
3
Baths
2,320
Sq Ft
$121/Sq Ft
Est. Value
About This Home
This home is located at 115 High St, Ashland, OH 44805 and is currently estimated at $280,785, approximately $121 per square foot. 115 High St is a home located in Ashland County with nearby schools including Ashland High School, Ashland County Community Academy, and St. Edward Elementary School.
Ownership History
Date
Name
Owned For
Owner Type
Purchase Details
Closed on
Nov 21, 2011
Sold by
Mcpherran Michael P
Bought by
Steiner Jeffrey M and Steiner Jenna B
Current Estimated Value
Home Financials for this Owner
Home Financials are based on the most recent Mortgage that was taken out on this home.
Original Mortgage
$100,000
Outstanding Balance
$77,425
Interest Rate
3.97%
Mortgage Type
New Conventional
Estimated Equity
$203,360
Purchase Details
Closed on
Jul 22, 2004
Sold by
Brown Douglas
Bought by
Mcpherran Ii Michael P
Purchase Details
Closed on
Jan 1, 1990
Bought by
Brown Douglas
Create a Home Valuation Report for This Property
The Home Valuation Report is an in-depth analysis detailing your home's value as well as a comparison with similar homes in the area
Home Values in the Area
Average Home Value in this Area
Purchase History
| Date | Buyer | Sale Price | Title Company |
|---|---|---|---|
| Steiner Jeffrey M | $125,000 | -- | |
| Mcpherran Ii Michael P | $111,000 | -- | |
| Brown Douglas | -- | -- |
Source: Public Records
Mortgage History
| Date | Status | Borrower | Loan Amount |
|---|---|---|---|
| Open | Steiner Jeffrey M | $100,000 | |
| Closed | Steiner Jeffrey M | $100,000 |
Source: Public Records
Tax History Compared to Growth
Tax History
| Year | Tax Paid | Tax Assessment Tax Assessment Total Assessment is a certain percentage of the fair market value that is determined by local assessors to be the total taxable value of land and additions on the property. | Land | Improvement |
|---|---|---|---|---|
| 2024 | $2,309 | $66,880 | $12,490 | $54,390 |
| 2023 | $2,309 | $66,880 | $12,490 | $54,390 |
| 2022 | $2,082 | $47,770 | $8,920 | $38,850 |
| 2021 | $2,091 | $47,770 | $8,920 | $38,850 |
| 2020 | $1,979 | $47,770 | $8,920 | $38,850 |
| 2019 | $1,820 | $40,650 | $8,710 | $31,940 |
| 2018 | $1,836 | $40,650 | $8,710 | $31,940 |
| 2017 | $1,843 | $40,650 | $8,710 | $31,940 |
| 2016 | $1,799 | $37,990 | $8,140 | $29,850 |
| 2015 | $1,783 | $37,990 | $8,140 | $29,850 |
| 2013 | $1,422 | $29,780 | $8,110 | $21,670 |
Source: Public Records
Map
Nearby Homes