115 Hunters Green Cir Little Rock, AR 72211
Hillsborough NeighborhoodEstimated Value: $314,000 - $357,545
2
Beds
2
Baths
1,808
Sq Ft
$186/Sq Ft
Est. Value
About This Home
This home is located at 115 Hunters Green Cir, Little Rock, AR 72211 and is currently estimated at $335,886, approximately $185 per square foot. 115 Hunters Green Cir is a home located in Pulaski County with nearby schools including Fulbright Elementary School, Pinnacle View Middle School, and LISA Academy West Elementary School.
Ownership History
Date
Name
Owned For
Owner Type
Purchase Details
Closed on
Apr 10, 2023
Sold by
Nilles Edward Leroy and Nilles Gerre Andrews
Bought by
Nilles David G
Current Estimated Value
Purchase Details
Closed on
Oct 3, 2016
Sold by
Dungan Betty G
Bought by
Nilles Edward Leroy and Nilles Gerre Andrews
Home Financials for this Owner
Home Financials are based on the most recent Mortgage that was taken out on this home.
Original Mortgage
$205,000
Interest Rate
3.43%
Mortgage Type
New Conventional
Purchase Details
Closed on
May 26, 2010
Sold by
Hocutt Lydia Ann and Hocutt Lydia A
Bought by
Dungan Betty G
Purchase Details
Closed on
May 5, 2005
Sold by
Hunters Green Development Co Llc
Bought by
Hocutt Lydia Ann
Home Financials for this Owner
Home Financials are based on the most recent Mortgage that was taken out on this home.
Original Mortgage
$176,000
Interest Rate
5.92%
Mortgage Type
Construction
Create a Home Valuation Report for This Property
The Home Valuation Report is an in-depth analysis detailing your home's value as well as a comparison with similar homes in the area
Home Values in the Area
Average Home Value in this Area
Purchase History
| Date | Buyer | Sale Price | Title Company |
|---|---|---|---|
| Nilles David G | $340,000 | Pulaski County Title | |
| Nilles Edward Leroy | -- | Pulaski County Title | |
| Niles Edward Leroy | $220,000 | Pulaski County Title | |
| Dungan Betty G | $220,000 | Lenders Title Company | |
| Hocutt Lydia Ann | $77,000 | The Title Company |
Source: Public Records
Mortgage History
| Date | Status | Borrower | Loan Amount |
|---|---|---|---|
| Previous Owner | Nilles Edward Leroy | $205,000 | |
| Previous Owner | Hocutt Lydia Ann | $176,000 |
Source: Public Records
Tax History Compared to Growth
Tax History
| Year | Tax Paid | Tax Assessment Tax Assessment Total Assessment is a certain percentage of the fair market value that is determined by local assessors to be the total taxable value of land and additions on the property. | Land | Improvement |
|---|---|---|---|---|
| 2025 | $3,372 | $48,168 | $12,000 | $36,168 |
| 2024 | $3,039 | $48,168 | $12,000 | $36,168 |
| 2023 | $3,039 | $48,168 | $12,000 | $36,168 |
| 2022 | $3,039 | $48,168 | $12,000 | $36,168 |
| 2021 | $3,060 | $43,410 | $13,700 | $29,710 |
| 2020 | $2,664 | $43,410 | $13,700 | $29,710 |
| 2019 | $2,664 | $43,410 | $13,700 | $29,710 |
| 2018 | $2,689 | $43,410 | $13,700 | $29,710 |
| 2017 | $2,689 | $43,410 | $13,700 | $29,710 |
| 2016 | $2,293 | $37,750 | $11,000 | $26,750 |
| 2015 | $2,646 | $37,750 | $11,000 | $26,750 |
| 2014 | $2,646 | $37,750 | $11,000 | $26,750 |
Source: Public Records
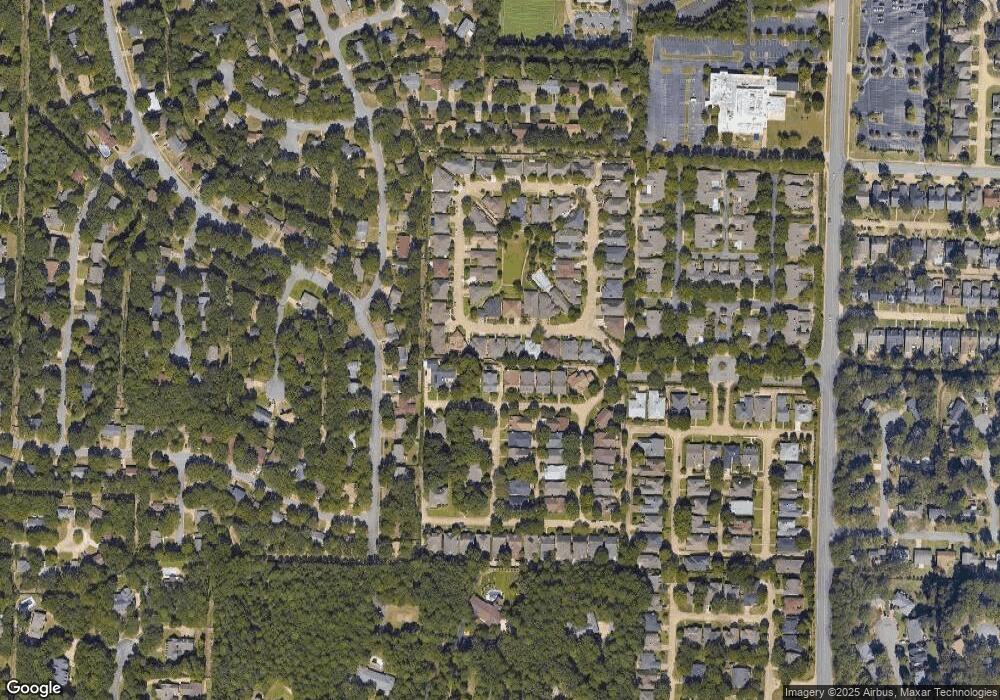
Map
Nearby Homes
- 1315 Gleneagles Ct
- 12821 Morrison Rd
- 1301 Gleneagles Ct
- 1821 Pickering Ln
- 1512 Ellen Ct
- 12910 Morrison Rd
- 12110 Pleasant Tree Dr
- 6 Ridgehaven Ct
- 1807 Shumate Dr
- 108 Mergeron Ct
- 6 Hunter Ct
- 111 Mergeron Ct
- 1802 Jennifer Dr
- 13110 Morrison Rd
- 15 Saint Charles Ct
- 11808 Saint Charles Blvd
- 63 Valley Estates Ct
- 12819 Saint Charles Blvd
- 1924 Hillsborough Ln
- 1508 Hillsborough Ln
- 119 Hunters Green Cir
- 111 Hunters Green Cir
- 12704 Hunters Field Rd
- 12700 Hunters Field Rd
- 123 Hunters Green Cir
- 107 Hunters Green Cir
- 112 Hunters Green Cir
- 12622 Hunters Field Rd
- 116 Hunters Green Cir
- 120 Hunters Green Cir
- 12716 Hunters Field Rd
- 127 Hunters Green Cir
- 12618 Hunters Field Rd
- 98 Hunters Green Cir
- 103 Hunters Green Cir
- 126 Hunters Green Cir
- 99 Hunters Green Cir
- 12614 Hunters Field Rd
- 94 Hunters Green Cir
- 131 Hunters Green Cir