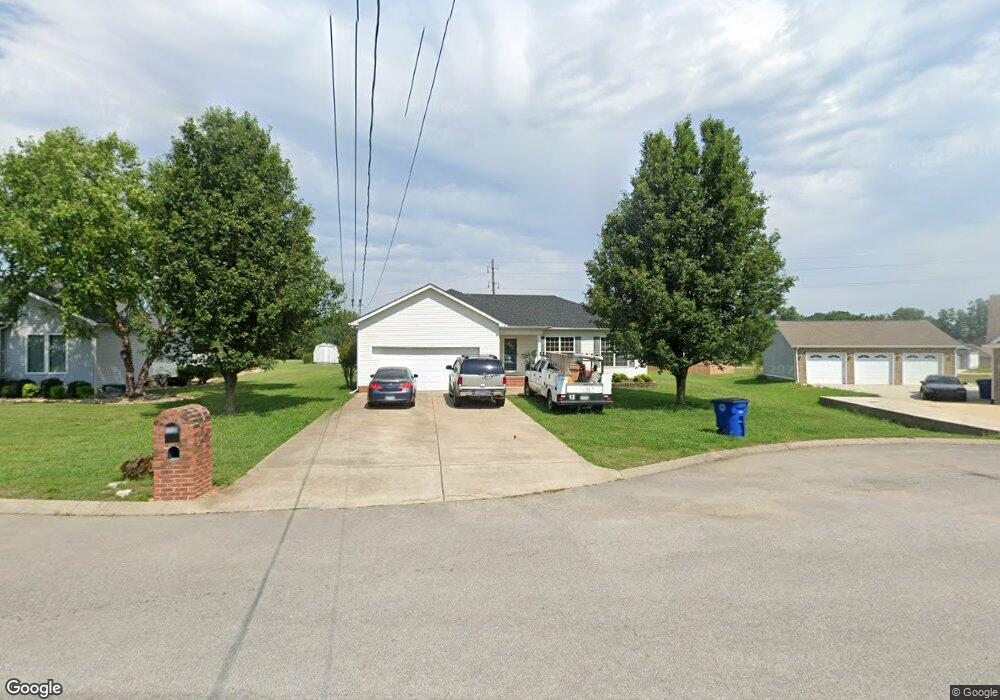
115 Kolby Dr Shelbyville, TN 37160
Estimated Value: $268,195 - $320,000
--
Bed
2
Baths
1,498
Sq Ft
$200/Sq Ft
Est. Value
About This Home
This home is located at 115 Kolby Dr, Shelbyville, TN 37160 and is currently estimated at $299,799, approximately $200 per square foot. 115 Kolby Dr is a home located in Bedford County with nearby schools including Liberty Elementary School and Christian Chapel Academy.
Ownership History
Date
Name
Owned For
Owner Type
Purchase Details
Closed on
Nov 17, 2005
Sold by
Leverette Kelli
Bought by
Cagle David Brian
Current Estimated Value
Home Financials for this Owner
Home Financials are based on the most recent Mortgage that was taken out on this home.
Original Mortgage
$112,140
Outstanding Balance
$61,078
Interest Rate
6.04%
Estimated Equity
$238,721
Purchase Details
Closed on
Oct 14, 2005
Sold by
Leverette Jerry W
Bought by
Leverette Kelli
Home Financials for this Owner
Home Financials are based on the most recent Mortgage that was taken out on this home.
Original Mortgage
$112,140
Outstanding Balance
$61,078
Interest Rate
6.04%
Estimated Equity
$238,721
Create a Home Valuation Report for This Property
The Home Valuation Report is an in-depth analysis detailing your home's value as well as a comparison with similar homes in the area
Home Values in the Area
Average Home Value in this Area
Purchase History
| Date | Buyer | Sale Price | Title Company |
|---|---|---|---|
| Cagle David Brian | $113,900 | -- | |
| Leverette Kelli | -- | -- |
Source: Public Records
Mortgage History
| Date | Status | Borrower | Loan Amount |
|---|---|---|---|
| Open | Leverette Kelli | $112,140 |
Source: Public Records
Tax History Compared to Growth
Tax History
| Year | Tax Paid | Tax Assessment Tax Assessment Total Assessment is a certain percentage of the fair market value that is determined by local assessors to be the total taxable value of land and additions on the property. | Land | Improvement |
|---|---|---|---|---|
| 2025 | -- | $46,000 | $0 | $0 |
| 2024 | -- | $46,000 | $7,000 | $39,000 |
| 2023 | $1,751 | $46,000 | $7,000 | $39,000 |
| 2022 | $1,801 | $46,000 | $7,000 | $39,000 |
| 2021 | $1,635 | $46,000 | $7,000 | $39,000 |
| 2020 | $1,336 | $46,000 | $7,000 | $39,000 |
| 2019 | $1,336 | $30,150 | $4,500 | $25,650 |
| 2018 | $1,306 | $30,150 | $4,500 | $25,650 |
| 2017 | $1,306 | $30,150 | $4,500 | $25,650 |
| 2016 | $1,294 | $30,150 | $4,500 | $25,650 |
| 2015 | $1,293 | $30,150 | $4,500 | $25,650 |
| 2014 | $1,140 | $29,080 | $0 | $0 |
Source: Public Records
Map
Nearby Homes