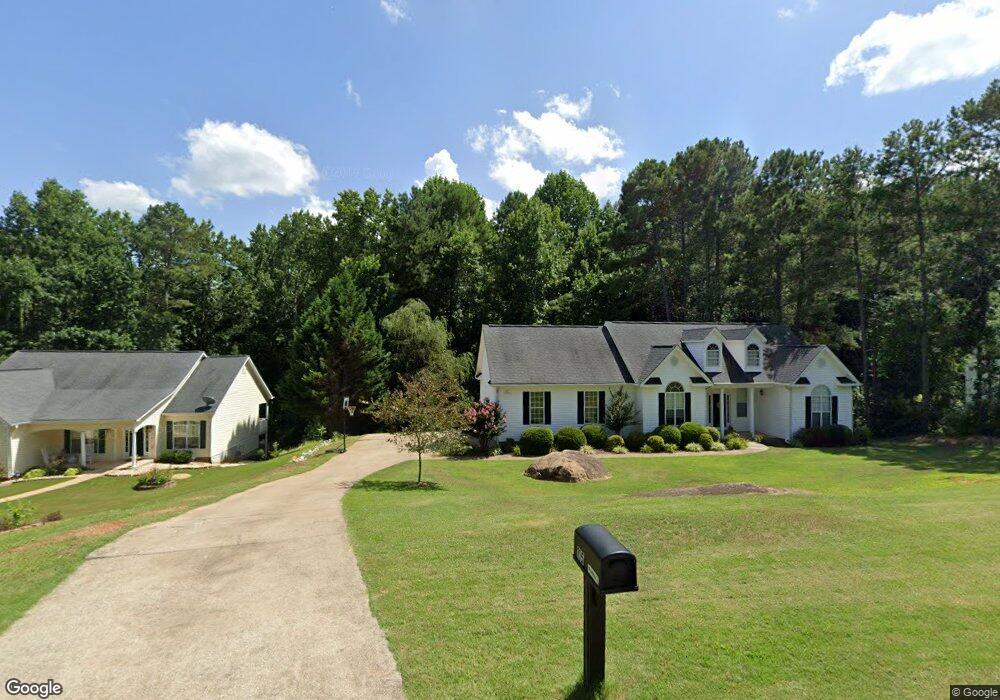
115 Line Creek Cir Sharpsburg, GA 30277
Estimated Value: $341,623 - $394,000
3
Beds
2
Baths
1,500
Sq Ft
$250/Sq Ft
Est. Value
About This Home
This home is located at 115 Line Creek Cir, Sharpsburg, GA 30277 and is currently estimated at $375,656, approximately $250 per square foot. 115 Line Creek Cir is a home located in Coweta County with nearby schools including Canongate Elementary School, Madras Middle School, and Northgate High School.
Ownership History
Date
Name
Owned For
Owner Type
Purchase Details
Closed on
Aug 15, 2000
Sold by
Benchmark Superior Homes Inc
Bought by
Jenkins James E
Current Estimated Value
Home Financials for this Owner
Home Financials are based on the most recent Mortgage that was taken out on this home.
Original Mortgage
$121,600
Outstanding Balance
$43,328
Interest Rate
8.17%
Mortgage Type
New Conventional
Estimated Equity
$332,328
Purchase Details
Closed on
Mar 24, 2000
Sold by
C & W Dev Inc
Bought by
Benchmark Superior Homes Inc
Home Financials for this Owner
Home Financials are based on the most recent Mortgage that was taken out on this home.
Original Mortgage
$114,750
Interest Rate
8.38%
Mortgage Type
New Conventional
Purchase Details
Closed on
Nov 13, 1997
Bought by
C & W Development In
Purchase Details
Closed on
May 28, 1993
Bought by
Zippilli Harriette H
Purchase Details
Closed on
May 21, 1993
Bought by
Trust Co Bank Of Nor
Purchase Details
Closed on
Apr 30, 1993
Bought by
H & A Investments In
Create a Home Valuation Report for This Property
The Home Valuation Report is an in-depth analysis detailing your home's value as well as a comparison with similar homes in the area
Home Values in the Area
Average Home Value in this Area
Purchase History
| Date | Buyer | Sale Price | Title Company |
|---|---|---|---|
| Jenkins James E | $152,000 | -- | |
| Benchmark Superior Homes Inc | $19,000 | -- | |
| Benchmark Superior H | $19,000 | -- | |
| C & W Development In | -- | -- | |
| Zippilli Harriette H | $300,000 | -- | |
| Trust Co Bank Of Nor | -- | -- | |
| H & A Investments In | $300,000 | -- |
Source: Public Records
Mortgage History
| Date | Status | Borrower | Loan Amount |
|---|---|---|---|
| Open | Jenkins James E | $121,600 | |
| Previous Owner | Benchmark Superior H | $114,750 |
Source: Public Records
Tax History Compared to Growth
Tax History
| Year | Tax Paid | Tax Assessment Tax Assessment Total Assessment is a certain percentage of the fair market value that is determined by local assessors to be the total taxable value of land and additions on the property. | Land | Improvement |
|---|---|---|---|---|
| 2025 | $3,504 | $157,657 | $30,000 | $127,657 |
| 2024 | $3,175 | $139,316 | $26,000 | $113,316 |
| 2023 | $3,175 | $142,893 | $26,000 | $116,893 |
| 2022 | $2,771 | $115,226 | $26,000 | $89,226 |
| 2021 | $2,361 | $92,540 | $18,000 | $74,540 |
| 2020 | $2,375 | $92,540 | $18,000 | $74,540 |
| 2019 | $2,085 | $74,414 | $16,000 | $58,414 |
| 2018 | $2,090 | $74,414 | $16,000 | $58,414 |
| 2017 | $1,829 | $65,546 | $12,000 | $53,546 |
| 2016 | $1,810 | $65,546 | $12,000 | $53,546 |
| 2015 | $1,880 | $68,953 | $12,000 | $56,953 |
| 2014 | $1,620 | $63,112 | $12,000 | $51,112 |
Source: Public Records
Map
Nearby Homes
- 11 Line Creek Cir
- 121 Northwoods Rd
- 95 Tyler Woods Dr
- 25 Sycamore Way
- 12 Race Point Way
- 100 Ashland Trail
- 104 Ashland Trail
- 319 Beaconsfield Dr
- 259 Strathmore Dr Unit 3
- 125 Cannongate Cir
- 150 Kylemore Pass
- 110 Kylemore Pass
- 10 Monteray Ct
- 20 Skipton Ct
- 75 Tomahawk Dr
- 131 Cannongate Cir
- 40 Wenham Ln
- 135 Crimson Ridge
- 70 N Strathmore Dr
- 115 Platinum Ridge
- 125 Line Creek Cir
- 95 Line Creek Cir
- 139 Line Creek Cir
- 139 Line Creek Cir Unit C/2
- 568 Line Creek Cir
- 84 Line Creek Cir
- 71 Line Creek Cir
- 140 Line Creek Cir
- 153 Line Creek Cir
- 70 Line Creek Cir
- 15 Line Creek Way
- 51 Line Creek Cir
- 146 Line Creek Cir
- 535 Line Creek Cir
- 29 Line Creek Way
- 155 Line Creek Cir
- 60 Line Creek Cir Unit 60
- 60 Line Creek Cir
- 60 Line Creek Cir Unit 143
- 43 Line Creek Cir