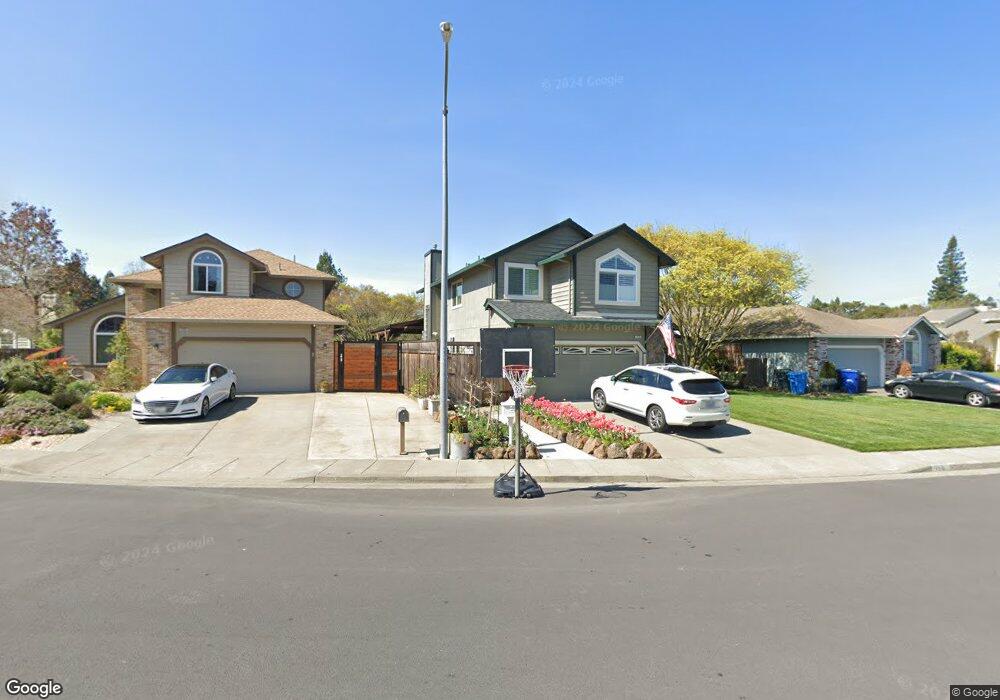
115 Macklin Dr Cotati, CA 94931
Estimated Value: $779,137 - $888,000
4
Beds
3
Baths
1,794
Sq Ft
$465/Sq Ft
Est. Value
About This Home
This home is located at 115 Macklin Dr, Cotati, CA 94931 and is currently estimated at $834,034, approximately $464 per square foot. 115 Macklin Dr is a home located in Sonoma County with nearby schools including Rancho Cotate High School, Cross & Crown Lutheran School, and Bridghaven.
Ownership History
Date
Name
Owned For
Owner Type
Purchase Details
Closed on
Dec 22, 2021
Sold by
Carrasco Troy M
Bought by
Carrasco Diana R
Current Estimated Value
Purchase Details
Closed on
Jul 10, 2003
Sold by
Carrasco Troy M
Bought by
Carrasco Troy M and Carrasco Diana R
Purchase Details
Closed on
Apr 20, 2000
Sold by
Carrasco Diana R
Bought by
Carrasco Troy
Home Financials for this Owner
Home Financials are based on the most recent Mortgage that was taken out on this home.
Original Mortgage
$262,500
Outstanding Balance
$90,061
Interest Rate
8.25%
Estimated Equity
$743,973
Purchase Details
Closed on
May 1, 1996
Sold by
Yeung Ying Chung and Tse Sau Chun
Bought by
Carrasco Troy M and Carrasco Diana R
Home Financials for this Owner
Home Financials are based on the most recent Mortgage that was taken out on this home.
Original Mortgage
$184,500
Interest Rate
7.96%
Create a Home Valuation Report for This Property
The Home Valuation Report is an in-depth analysis detailing your home's value as well as a comparison with similar homes in the area
Home Values in the Area
Average Home Value in this Area
Purchase History
| Date | Buyer | Sale Price | Title Company |
|---|---|---|---|
| Carrasco Diana R | -- | None Available | |
| Carrasco Troy M | -- | -- | |
| Carrasco Troy | -- | First American Title Co | |
| Carrasco Troy | -- | First American Title Co | |
| Carrasco Troy M | $187,363 | Chicago Title Co |
Source: Public Records
Mortgage History
| Date | Status | Borrower | Loan Amount |
|---|---|---|---|
| Open | Carrasco Troy | $262,500 | |
| Closed | Carrasco Troy M | $184,500 |
Source: Public Records
Tax History
| Year | Tax Paid | Tax Assessment Tax Assessment Total Assessment is a certain percentage of the fair market value that is determined by local assessors to be the total taxable value of land and additions on the property. | Land | Improvement |
|---|---|---|---|---|
| 2025 | $4,046 | $327,312 | $127,727 | $199,585 |
| 2024 | $4,046 | $320,895 | $125,223 | $195,672 |
| 2023 | $4,046 | $314,604 | $122,768 | $191,836 |
| 2022 | $3,952 | $308,436 | $120,361 | $188,075 |
| 2021 | $3,913 | $302,389 | $118,001 | $184,388 |
| 2020 | $3,955 | $299,290 | $116,792 | $182,498 |
| 2019 | $3,905 | $293,422 | $114,502 | $178,920 |
| 2018 | $3,575 | $287,669 | $112,257 | $175,412 |
| 2017 | $3,516 | $282,029 | $110,056 | $171,973 |
| 2016 | $3,369 | $276,500 | $107,899 | $168,601 |
| 2015 | $3,288 | $272,348 | $106,279 | $166,069 |
| 2014 | $3,265 | $267,014 | $104,198 | $162,816 |
Source: Public Records
Map
Nearby Homes
- 8873 Lebec Ln
- 95 Jagla St
- 105 Falcon Dr
- 65 Lasker Ln
- 9 Ramble Creek Dr
- 293 Lincoln Ave
- 8383 Lasalle Ave Unit 66
- 8175 Arthur St
- 9011 Cypress Ave
- 8633 Lancaster Dr
- 8 Bay Tree Ct
- 286 Bruce Ave
- 302 Floral Dr
- 7799 Blair Ave
- 117 Silver Dr
- 850 E Cotati Ave Unit 11
- 79 William St Unit S
- 6698 Santero Way
- 1217 Mateo Dr
- 1216 Mateo Dr
- 111 Macklin Dr
- 119 Macklin Dr
- 201 Mendelssohn Ct
- 123 Macklin Dr
- 203 Mendelssohn Ct
- 116 Macklin Dr
- 112 Macklin Dr
- 120 Macklin Dr
- 108 Macklin Dr
- 127 Macklin Dr
- 107 Macklin Dr
- 104 Macklin Dr
- 124 Macklin Dr
- 207 Mendelssohn Ct
- 200 Skilling Ct
- 131 Macklin Dr
- 201 Skilling Ct
- 103 Macklin Dr
- 100 Macklin Dr
- 200 Mendelssohn Ct
Your Personal Tour Guide
Ask me questions while you tour the home.