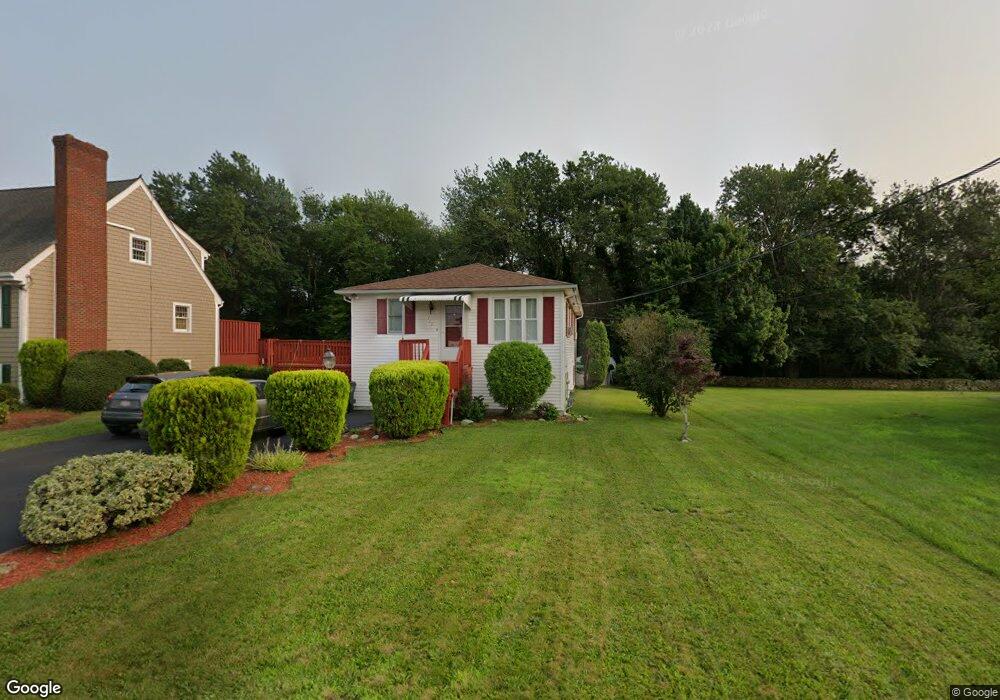
115 Meeson St Fall River, MA 02724
Maplewood NeighborhoodEstimated Value: $424,000 - $442,000
3
Beds
2
Baths
1,440
Sq Ft
$301/Sq Ft
Est. Value
About This Home
This home is located at 115 Meeson St, Fall River, MA 02724 and is currently estimated at $432,871, approximately $300 per square foot. 115 Meeson St is a home located in Bristol County with nearby schools including Henry Lord Community School, B M C Durfee High School, and Argosy Collegiate Charter School.
Ownership History
Date
Name
Owned For
Owner Type
Purchase Details
Closed on
Jan 31, 2005
Sold by
Luciano James A and Luciano Maria J
Bought by
Chibante Gilberto and Chibante Maria D
Current Estimated Value
Home Financials for this Owner
Home Financials are based on the most recent Mortgage that was taken out on this home.
Original Mortgage
$182,800
Outstanding Balance
$92,425
Interest Rate
5.67%
Mortgage Type
Purchase Money Mortgage
Estimated Equity
$340,446
Purchase Details
Closed on
Feb 6, 1998
Sold by
Nunes John R and Nunes Noella
Bought by
Luciano James A and Luciano Maria J
Purchase Details
Closed on
Jan 26, 1990
Sold by
Demello Victor
Bought by
Nunes John R
Create a Home Valuation Report for This Property
The Home Valuation Report is an in-depth analysis detailing your home's value as well as a comparison with similar homes in the area
Home Values in the Area
Average Home Value in this Area
Purchase History
| Date | Buyer | Sale Price | Title Company |
|---|---|---|---|
| Chibante Gilberto | $241,000 | -- | |
| Luciano James A | $118,000 | -- | |
| Nunes John R | $120,000 | -- |
Source: Public Records
Mortgage History
| Date | Status | Borrower | Loan Amount |
|---|---|---|---|
| Open | Nunes John R | $182,800 | |
| Closed | Nunes John R | $48,200 | |
| Closed | Nunes John R | $8,669 |
Source: Public Records
Tax History
| Year | Tax Paid | Tax Assessment Tax Assessment Total Assessment is a certain percentage of the fair market value that is determined by local assessors to be the total taxable value of land and additions on the property. | Land | Improvement |
|---|---|---|---|---|
| 2025 | $4,269 | $372,800 | $126,400 | $246,400 |
| 2024 | $3,977 | $346,100 | $121,600 | $224,500 |
| 2023 | $3,894 | $317,400 | $104,300 | $213,100 |
| 2022 | $3,366 | $266,700 | $94,800 | $171,900 |
| 2021 | $3,191 | $230,700 | $87,700 | $143,000 |
| 2020 | $3,058 | $211,600 | $83,900 | $127,700 |
| 2019 | $2,900 | $198,900 | $79,900 | $119,000 |
| 2018 | $2,795 | $191,200 | $78,500 | $112,700 |
| 2017 | $2,671 | $190,800 | $80,100 | $110,700 |
| 2016 | $2,567 | $188,300 | $83,400 | $104,900 |
| 2015 | $2,454 | $187,600 | $80,300 | $107,300 |
| 2014 | $2,413 | $191,800 | $84,500 | $107,300 |
Source: Public Records
Map
Nearby Homes
Your Personal Tour Guide
Ask me questions while you tour the home.