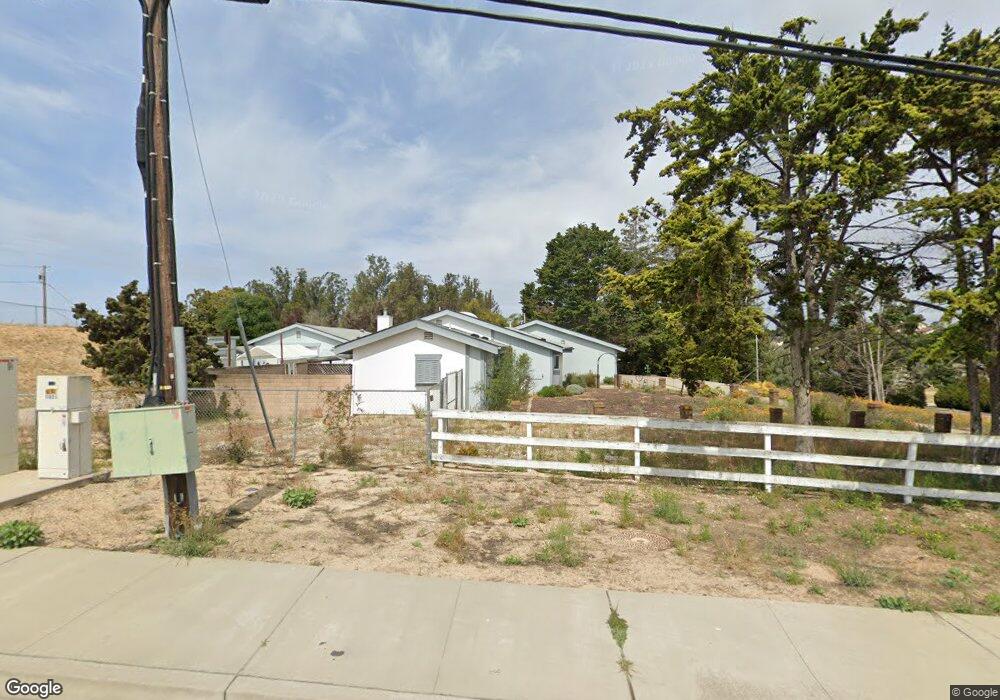
115 Mesa Rd Nipomo, CA 93444
Estimated Value: $759,000 - $1,075,000
3
Beds
2
Baths
1,790
Sq Ft
$531/Sq Ft
Est. Value
About This Home
This home is located at 115 Mesa Rd, Nipomo, CA 93444 and is currently estimated at $951,148, approximately $531 per square foot. 115 Mesa Rd is a home located in San Luis Obispo County with nearby schools including Dana Elementary School, Mesa Middle School, and Nipomo High School.
Ownership History
Date
Name
Owned For
Owner Type
Purchase Details
Closed on
Aug 6, 2014
Sold by
Chapman Wayne G and Chapman Eunice E
Bought by
George A Lepper & Marie A Lepper Family
Current Estimated Value
Purchase Details
Closed on
Jul 19, 1996
Sold by
Bowers Lionel C and Bowers Barbara L
Bought by
Chapman Wayne G and Chapman Eunice E
Home Financials for this Owner
Home Financials are based on the most recent Mortgage that was taken out on this home.
Original Mortgage
$179,000
Interest Rate
8.33%
Create a Home Valuation Report for This Property
The Home Valuation Report is an in-depth analysis detailing your home's value as well as a comparison with similar homes in the area
Home Values in the Area
Average Home Value in this Area
Purchase History
| Date | Buyer | Sale Price | Title Company |
|---|---|---|---|
| George A Lepper & Marie A Lepper Family | $450,000 | Fidelity National Title Co | |
| Chapman Wayne G | $259,000 | Chicago Title Co |
Source: Public Records
Mortgage History
| Date | Status | Borrower | Loan Amount |
|---|---|---|---|
| Previous Owner | Chapman Wayne G | $179,000 |
Source: Public Records
Tax History
| Year | Tax Paid | Tax Assessment Tax Assessment Total Assessment is a certain percentage of the fair market value that is determined by local assessors to be the total taxable value of land and additions on the property. | Land | Improvement |
|---|---|---|---|---|
| 2025 | $5,489 | $540,824 | $240,367 | $300,457 |
| 2024 | $5,425 | $530,220 | $235,654 | $294,566 |
| 2023 | $5,425 | $519,825 | $231,034 | $288,791 |
| 2022 | $5,342 | $509,633 | $226,504 | $283,129 |
| 2021 | $5,331 | $499,641 | $222,063 | $277,578 |
| 2020 | $5,269 | $494,519 | $219,787 | $274,732 |
| 2019 | $5,235 | $484,824 | $215,478 | $269,346 |
| 2018 | $5,171 | $475,318 | $211,253 | $264,065 |
| 2017 | $5,073 | $465,999 | $207,111 | $258,888 |
| 2016 | $4,783 | $456,862 | $203,050 | $253,812 |
| 2015 | $4,713 | $450,000 | $200,000 | $250,000 |
| 2014 | $3,522 | $344,087 | $152,780 | $191,307 |
Source: Public Records
Map
Nearby Homes
- 270 S Tejas Place
- 353 Uranus Ct
- 250 Via Promesa
- 429 Saturn Ct
- 366 Venus Ct
- 461 Saturn Ct
- 375 Kestrel Way
- 468 Neptune Dr
- 945 Jeanette Ln
- 850 Primrose Ln
- 325 Black Hawk Way
- 345 Black Hawk Way
- 219 Lema Dr
- 340 N Las Flores Dr
- 290 Daffodil Ave
- 778 Primrose Ln
- 719 W Tefft St
- 522 Higos Way
- 341 N Las Flores Dr
- 483 Violet Ave
Your Personal Tour Guide
Ask me questions while you tour the home.