Estimated Value: $94,000 - $141,000
3
Beds
3
Baths
2,100
Sq Ft
$57/Sq Ft
Est. Value
About This Home
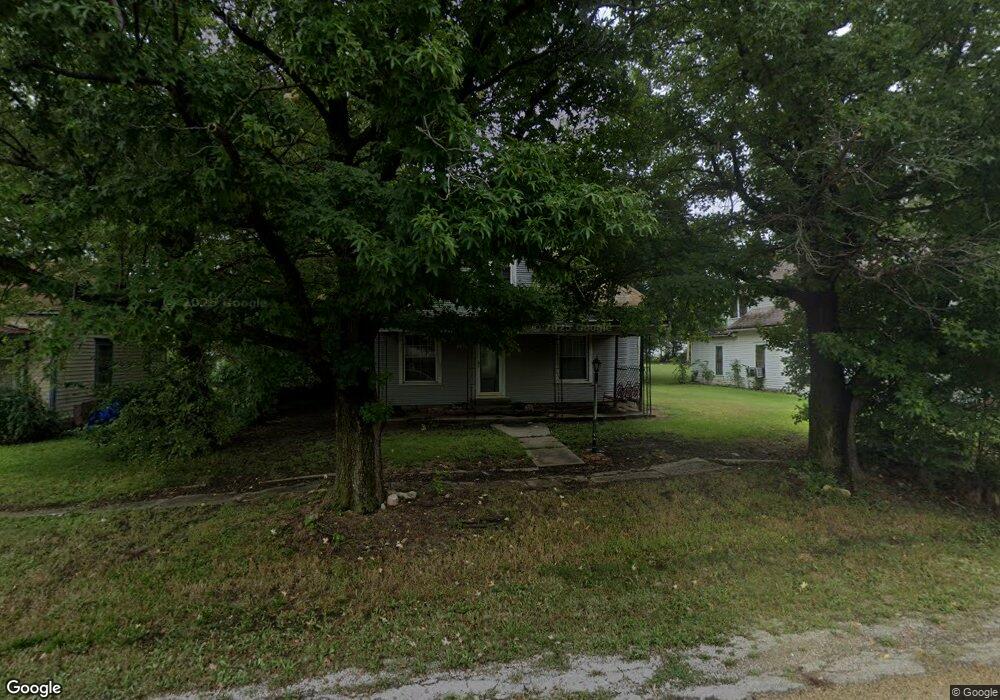
This home is located at 115 N 1st St, Hope, KS 67451 and is currently estimated at $119,840, approximately $57 per square foot. 115 N 1st St is a home located in Dickinson County with nearby schools including Hope Elementary School and Hope High School.
Ownership History
Date
Name
Owned For
Owner Type
Purchase Details
Closed on
Sep 17, 2003
Sold by
Mcrae Michelle M
Bought by
Mcrae Michael A
Current Estimated Value
Create a Home Valuation Report for This Property
The Home Valuation Report is an in-depth analysis detailing your home's value as well as a comparison with similar homes in the area
Purchase History
| Date | Buyer | Sale Price | Title Company |
|---|---|---|---|
| Mcrae Michael A | -- | -- |
Source: Public Records
Tax History
| Year | Tax Paid | Tax Assessment Tax Assessment Total Assessment is a certain percentage of the fair market value that is determined by local assessors to be the total taxable value of land and additions on the property. | Land | Improvement |
|---|---|---|---|---|
| 2025 | $1,636 | $11,222 | $593 | $10,629 |
| 2024 | $1,583 | $10,688 | $593 | $10,095 |
| 2023 | $1,550 | $10,278 | $421 | $9,857 |
| 2022 | $1,415 | $9,259 | $521 | $8,738 |
| 2021 | $1,329 | $8,573 | $743 | $7,830 |
| 2020 | $1,248 | $8,127 | $804 | $7,323 |
| 2019 | $1,296 | $8,570 | $373 | $8,197 |
| 2018 | $1,221 | $8,379 | $277 | $8,102 |
| 2017 | $1,180 | $7,973 | $235 | $7,738 |
| 2016 | $1,252 | $8,498 | $235 | $8,263 |
| 2015 | -- | $8,896 | $235 | $8,661 |
| 2014 | -- | $8,895 | $409 | $8,486 |
Source: Public Records
Map
Nearby Homes
Your Personal Tour Guide
Ask me questions while you tour the home.