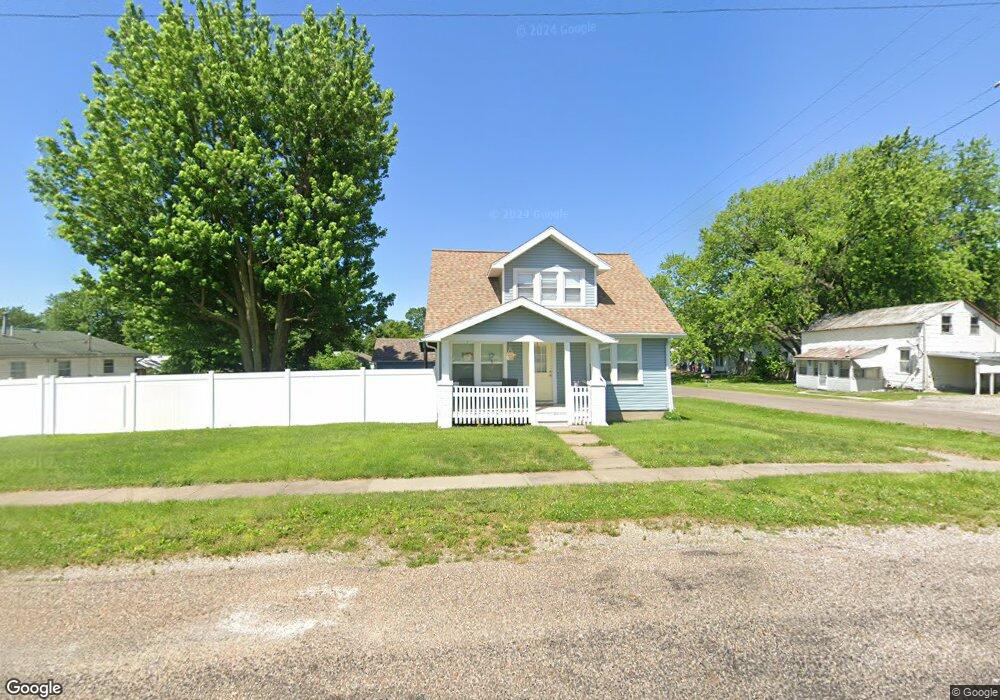
115 N Main St Payson, IL 62360
Estimated Value: $153,243 - $179,000
3
Beds
2
Baths
1,442
Sq Ft
$112/Sq Ft
Est. Value
About This Home
This home is located at 115 N Main St, Payson, IL 62360 and is currently estimated at $161,061, approximately $111 per square foot. 115 N Main St is a home located in Adams County with nearby schools including Seymour Elementary School and Seymour High School.
Ownership History
Date
Name
Owned For
Owner Type
Purchase Details
Closed on
Apr 30, 2020
Sold by
Hickman Benjamin O
Bought by
Peters Aaron A and Peters Whitney N
Current Estimated Value
Home Financials for this Owner
Home Financials are based on the most recent Mortgage that was taken out on this home.
Original Mortgage
$116,400
Outstanding Balance
$103,531
Interest Rate
3.5%
Mortgage Type
New Conventional
Estimated Equity
$57,530
Purchase Details
Closed on
Dec 13, 2019
Sold by
Epping Michael R
Bought by
Hickman Benjamin O and Terstriep Kyle D
Home Financials for this Owner
Home Financials are based on the most recent Mortgage that was taken out on this home.
Original Mortgage
$24,000
Interest Rate
3.6%
Mortgage Type
New Conventional
Purchase Details
Closed on
Aug 7, 2018
Sold by
Epping Richard A
Bought by
Epping Mr Michael R
Create a Home Valuation Report for This Property
The Home Valuation Report is an in-depth analysis detailing your home's value as well as a comparison with similar homes in the area
Purchase History
| Date | Buyer | Sale Price | Title Company |
|---|---|---|---|
| Peters Aaron A | $120,000 | Title Center | |
| Hickman Benjamin O | $30,000 | Title Center | |
| Epping Mr Michael R | -- | -- |
Source: Public Records
Mortgage History
| Date | Status | Borrower | Loan Amount |
|---|---|---|---|
| Open | Peters Aaron A | $116,400 | |
| Previous Owner | Hickman Benjamin O | $24,000 |
Source: Public Records
Tax History
| Year | Tax Paid | Tax Assessment Tax Assessment Total Assessment is a certain percentage of the fair market value that is determined by local assessors to be the total taxable value of land and additions on the property. | Land | Improvement |
|---|---|---|---|---|
| 2024 | $2,579 | $45,510 | $3,590 | $41,920 |
| 2023 | $2,471 | $42,380 | $3,340 | $39,040 |
| 2022 | $2,461 | $41,160 | $3,170 | $37,990 |
| 2021 | $2,421 | $39,990 | $3,080 | $36,910 |
| 2020 | $1,472 | $20,450 | $3,340 | $17,110 |
| 2019 | $1,546 | $27,260 | $3,220 | $24,040 |
| 2018 | $982 | $26,470 | $3,130 | $23,340 |
| 2017 | $933 | $25,690 | $3,040 | $22,650 |
| 2016 | $295 | $24,070 | $2,850 | $21,220 |
| 2015 | $7,966,800 | $24,070 | $2,850 | $21,220 |
| 2012 | $475 | $23,450 | $2,780 | $20,670 |
Source: Public Records
Map
Nearby Homes
- 406 N Main St
- 409 N Main St
- 419 Willow St
- 281 North Ave
- 7512 Southway Ct
- .031 ac m/l Angle St
- 1019 Burton Meadows Rd
- 5585 Woodcrest Dr
- 1433 Hemingway
- 3635 Timberline Dr
- 000 205th St
- 1522 Rim Rd
- 4915 Sunview Dr
- 110 S East St
- 6603 Gardner Expy
- 1170 E 1330th St
- 1183 E 1330th St
- 803 Maas Rd
- 3314 Wynstone Dr
- 4706 Caleb Ln
- 113 N Main St
- 103 W Edwards St
- 102 W Edwards St
- 104 W Edwards St
- 105 W Edwards St
- 205 N Main St
- 105 E Edwards St
- 112 N Fulton St
- 101 N Main St
- 104 W State St
- 108 W Edwards St
- 201 E Edwards St
- 106 N Fulton St
- 102 S Main St
- 108 N Park St
- 0 Illinois 96
- 116 N Park St
- 103 W Mill St
- 212 N Main St
- 100 S Main St
Your Personal Tour Guide
Ask me questions while you tour the home.