Estimated Value: $375,000 - $489,000
3
Beds
3
Baths
2,320
Sq Ft
$183/Sq Ft
Est. Value
About This Home
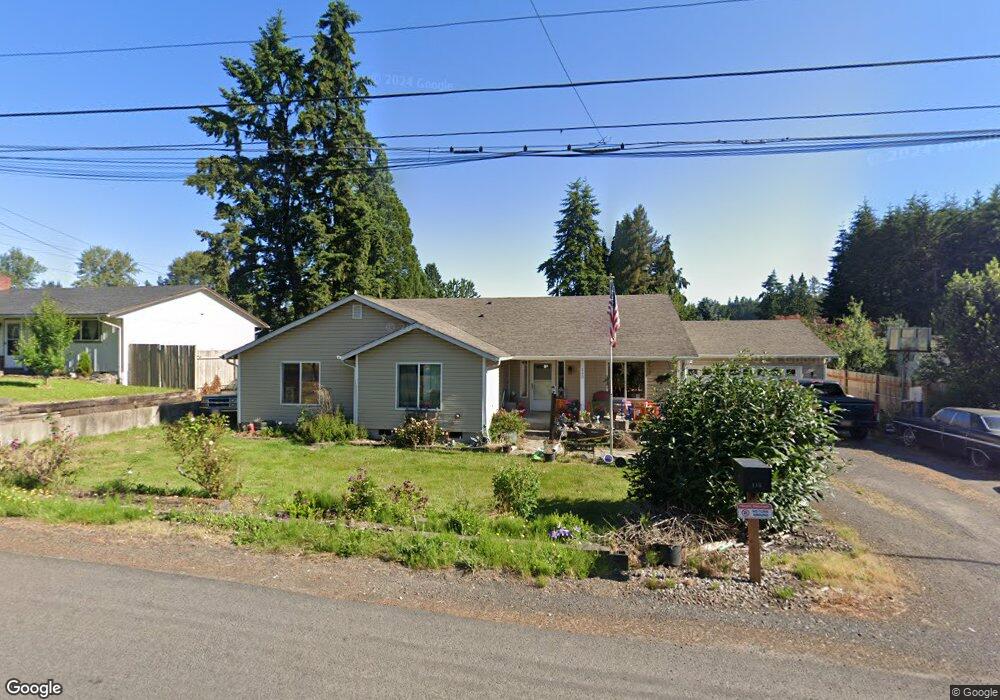
This home is located at 115 N Maple St, Kelso, WA 98626 and is currently estimated at $424,234, approximately $182 per square foot. 115 N Maple St is a home located in Cowlitz County with nearby schools including Barnes Elementary School, Huntington Middle School, and Kelso High School.
Create a Home Valuation Report for This Property
The Home Valuation Report is an in-depth analysis detailing your home's value as well as a comparison with similar homes in the area
Tax History
| Year | Tax Paid | Tax Assessment Tax Assessment Total Assessment is a certain percentage of the fair market value that is determined by local assessors to be the total taxable value of land and additions on the property. | Land | Improvement |
|---|---|---|---|---|
| 2024 | $4,856 | $380,180 | $40,300 | $339,880 |
| 2023 | $4,738 | $388,400 | $38,020 | $350,380 |
| 2022 | $4,455 | $366,000 | $35,200 | $330,800 |
| 2021 | $4,271 | $321,800 | $32,250 | $289,550 |
| 2020 | $4,125 | $358,730 | $28,050 | $330,680 |
| 2019 | $4,278 | $277,490 | $26,710 | $250,780 |
| 2018 | $4,063 | $277,490 | $26,710 | $250,780 |
| 2017 | $3,516 | $239,140 | $25,440 | $213,700 |
| 2016 | $3,137 | $202,490 | $23,130 | $179,360 |
| 2015 | $3,110 | $183,830 | $23,270 | $160,560 |
| 2013 | -- | $163,230 | $22,380 | $140,850 |
Source: Public Records
Map
Nearby Homes
- 1914 N Pacific Ave
- 119 Williams Ave
- 214 Holcomb Ave Unit B8
- 52 Veys Dr
- 55 Veys Dr
- 109 Barnes St
- 100 Inglewood Dr
- 1409 Bowmont Ave
- 151 Beacon Hill Dr
- 214 Inglewood Dr
- 115 Alpha Dr
- 2427 Archwood Dr
- 2429 Archwood Dr
- 1431 N 14th Ave
- 2431 W Lynnwood Dr
- 0 E Lynnwood Dr
- 2327 Lynnwood Dr
- 175 Shoreview Dr
- 163 Alpha Dr
- 508 Nevada Dr
- 111 N Maple St
- 117 N Maple St
- 109 N Maple St
- 119 N Maple St
- 107 N Maple St
- 112 N Maple St
- 110 N Maple St
- 116 Williams Ave
- 118 N Maple St
- 1920 N Pacific Ave
- 105 N Maple St
- 110 Williams Ave
- 120 N Maple St
- 123 N Maple St
- 1924 Pacific Ave N
- 120 Williams Ave
- 122 N Maple St
- 106 Williams Ave
- 104 Williams Ave
- 122 Williams Ave
Your Personal Tour Guide
Ask me questions while you tour the home.