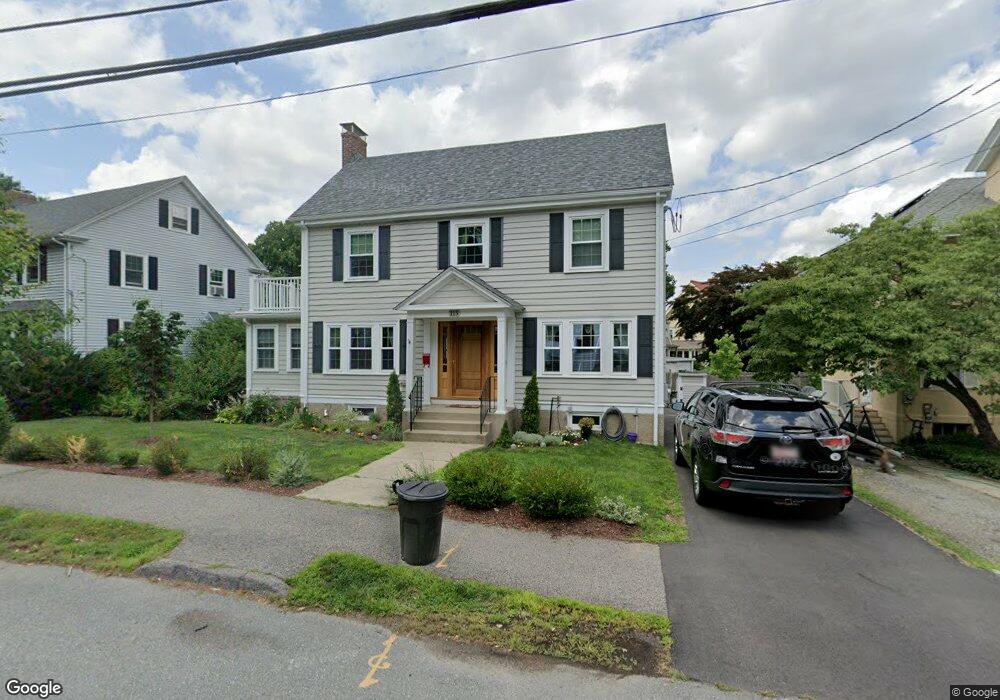
115 Nonantum St Newton, MA 02458
Newton Corner NeighborhoodEstimated Value: $1,426,000 - $1,684,000
3
Beds
3
Baths
1,386
Sq Ft
$1,120/Sq Ft
Est. Value
About This Home
This home is located at 115 Nonantum St, Newton, MA 02458 and is currently estimated at $1,552,989, approximately $1,120 per square foot. 115 Nonantum St is a home located in Middlesex County with nearby schools including Underwood Elementary School, Bigelow Middle School, and Newton North High School.
Ownership History
Date
Name
Owned For
Owner Type
Purchase Details
Closed on
Oct 28, 2009
Sold by
Est Hennessey Mary A and Hennessey Richard
Bought by
Bellmore Shawn and Bellmore Nancy
Current Estimated Value
Home Financials for this Owner
Home Financials are based on the most recent Mortgage that was taken out on this home.
Original Mortgage
$456,000
Outstanding Balance
$298,662
Interest Rate
5.06%
Mortgage Type
Purchase Money Mortgage
Estimated Equity
$1,254,327
Create a Home Valuation Report for This Property
The Home Valuation Report is an in-depth analysis detailing your home's value as well as a comparison with similar homes in the area
Home Values in the Area
Average Home Value in this Area
Purchase History
| Date | Buyer | Sale Price | Title Company |
|---|---|---|---|
| Bellmore Shawn | $570,000 | -- |
Source: Public Records
Mortgage History
| Date | Status | Borrower | Loan Amount |
|---|---|---|---|
| Open | Bellmore Shawn | $456,000 |
Source: Public Records
Tax History Compared to Growth
Tax History
| Year | Tax Paid | Tax Assessment Tax Assessment Total Assessment is a certain percentage of the fair market value that is determined by local assessors to be the total taxable value of land and additions on the property. | Land | Improvement |
|---|---|---|---|---|
| 2025 | $14,045 | $1,433,200 | $919,800 | $513,400 |
| 2024 | $13,581 | $1,391,500 | $893,000 | $498,500 |
| 2023 | $13,015 | $1,278,500 | $672,200 | $606,300 |
| 2022 | $12,454 | $1,183,800 | $622,400 | $561,400 |
| 2021 | $12,017 | $1,116,800 | $587,200 | $529,600 |
| 2020 | $10,010 | $958,800 | $587,200 | $371,600 |
| 2019 | $7,798 | $746,200 | $570,100 | $176,100 |
| 2018 | $7,391 | $683,100 | $515,300 | $167,800 |
| 2017 | $7,166 | $644,400 | $486,100 | $158,300 |
| 2016 | $6,853 | $602,200 | $454,300 | $147,900 |
| 2015 | $6,534 | $562,800 | $424,600 | $138,200 |
Source: Public Records
Map
Nearby Homes
- 206 Franklin St
- 106 Farlow Rd
- 68 Vernon St
- 548 Centre St Unit 5
- 59 Hyde Ave
- 642 Centre St
- 70 Washington St Unit 70
- 70 Washington St
- 121 Tremont St Unit B1
- 35 George St Unit 35
- 37 George St Unit 37
- 686 Centre St
- 159 Washington St Unit 4
- 99 Tremont St Unit 105
- 99 Tremont St Unit 413
- 9 Baldwin St Unit 15C
- 180 Hunnewell Ave Unit 180
- 65-67 Saint James Cir
- 21 Glenley Terrace
- 12 Richardson St Unit 14
- 166 Waverley Ave
- 117 Nonantum St
- 162 Waverley Ave
- 6 Blackstone Terrace
- 112 Nonantum St
- 10 Blackstone Terrace
- 106 Nonantum St
- 156 Waverley Ave
- 46 Blackstone Terrace Unit 46
- 185 Franklin St
- 100 Nonantum St
- 14 Blackstone Terrace
- 177 Franklin St
- 175 Waverley Ave
- 175 Waverley Ave
- 163 Waverley Ave
- 93 Nonantum St
- 167 Waverley Ave
- 9 Blackstone Terrace
- 169 Franklin St