S
Seller's Agent in 2019
Sandra McCarron
Capital Residential Group, LLC
(617) 549-1954
4 in this area
6 Total Sales
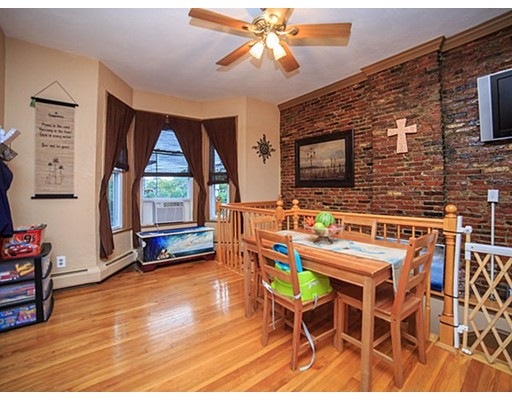


Location Location Location - 2 blocks from the beach.This first floor, bi-level, unit offers two bedrooms and two full baths with exposed brick, open floor plan, hardwood floors and yard /patio cannot be missed. Updates include Energy Efficient Heating System (Furnace/Water Heater), Energy Efficient Stackable Washer/Dryer, and Basement level hardwood floors all done in November 2005. Fridge is approximately 7 years old and Stainless Steel Appliances - Stove, Microwave and Dishwasher were replaced within the last 4-5 years. Basement windows are 10 years old and 1st floor windows were replaced around 15-20 years ago. Rubber Roof was done around 2006 and blown in insulation roughly 4-5 years ago. 1st floor bedroom hardwood floors 7 years ago, refinished the living room/kitchen floors to match the wood. See attached Condo Pet Policy.
Last Agent to Sell the Property
Nicole Byrne
The Galvin Group, LLC Listed on: 05/31/2016
Home Type
Condominium
Est. Annual Taxes
$7,021
Year Built
1910
Lot Details
0
| Date | Type | Sale Price | Title Company |
|---|---|---|---|
| Quit Claim Deed | -- | None Available | |
| Condominium Deed | $570,000 | -- | |
| Not Resolvable | $497,000 | -- | |
| Deed | $250,000 | -- |
| Date | Status | Loan Amount | Loan Type |
|---|---|---|---|
| Open | $503,000 | New Conventional | |
| Previous Owner | $513,000 | New Conventional | |
| Previous Owner | $397,600 | New Conventional | |
| Previous Owner | $100,000 | Credit Line Revolving | |
| Previous Owner | $236,000 | No Value Available | |
| Previous Owner | $242,500 | Purchase Money Mortgage |
| Date | Event | Price | Change | Sq Ft Price |
|---|---|---|---|---|
| 03/15/2019 03/15/19 | Sold | $570,000 | -1.6% | $595 / Sq Ft |
| 01/30/2019 01/30/19 | Pending | -- | -- | -- |
| 01/04/2019 01/04/19 | Price Changed | $579,000 | -3.3% | $604 / Sq Ft |
| 11/19/2018 11/19/18 | For Sale | $599,000 | 0.0% | $625 / Sq Ft |
| 07/20/2018 07/20/18 | Rented | $2,800 | -3.4% | -- |
| 07/18/2018 07/18/18 | Under Contract | -- | -- | -- |
| 07/09/2018 07/09/18 | Price Changed | $2,900 | -3.3% | $3 / Sq Ft |
| 06/19/2018 06/19/18 | For Rent | $3,000 | +7.1% | -- |
| 09/13/2016 09/13/16 | Rented | $2,800 | 0.0% | -- |
| 09/09/2016 09/09/16 | Price Changed | $2,800 | 0.0% | $3 / Sq Ft |
| 08/29/2016 08/29/16 | Sold | $500,000 | 0.0% | $522 / Sq Ft |
| 08/26/2016 08/26/16 | Price Changed | $2,850 | -1.7% | $3 / Sq Ft |
| 08/20/2016 08/20/16 | Price Changed | $2,900 | -1.7% | $3 / Sq Ft |
| 08/16/2016 08/16/16 | Price Changed | $2,950 | -1.7% | $3 / Sq Ft |
| 08/11/2016 08/11/16 | For Rent | $3,000 | 0.0% | -- |
| 06/06/2016 06/06/16 | Pending | -- | -- | -- |
| 05/31/2016 05/31/16 | For Sale | $479,000 | -- | $500 / Sq Ft |
| Year | Tax Paid | Tax Assessment Tax Assessment Total Assessment is a certain percentage of the fair market value that is determined by local assessors to be the total taxable value of land and additions on the property. | Land | Improvement |
|---|---|---|---|---|
| 2025 | $7,021 | $606,300 | $0 | $606,300 |
| 2024 | $6,334 | $581,100 | $0 | $581,100 |
| 2023 | $6,114 | $569,300 | $0 | $569,300 |
| 2022 | $5,955 | $547,300 | $0 | $547,300 |
| 2021 | $5,726 | $536,600 | $0 | $536,600 |
| 2020 | $5,397 | $511,100 | $0 | $511,100 |
| 2019 | $5,036 | $477,800 | $0 | $477,800 |
| 2018 | $4,767 | $454,900 | $0 | $454,900 |
| 2017 | $4,198 | $396,400 | $0 | $396,400 |
| 2016 | $4,113 | $373,900 | $0 | $373,900 |
| 2015 | $4,192 | $346,200 | $0 | $346,200 |
| 2014 | $3,887 | $309,000 | $0 | $309,000 |
S
Seller's Agent in 2019
Sandra McCarron
Capital Residential Group, LLC
(617) 549-1954
4 in this area
6 Total Sales
D
Buyer's Agent in 2019
Dylan Roast
Compass
(973) 525-5039
5 in this area
14 Total Sales

Buyer's Agent in 2018
George Bahnan
Bahnan Realty Company
(508) 635-7758
1 in this area
28 Total Sales
N
Seller's Agent in 2016
Nicole Byrne
The Galvin Group, LLC
R
Buyer's Agent in 2016
Rachel Delfino
Compass
(617) 733-1515
Source: MLS Property Information Network (MLS PIN)
MLS Number: 72013934
APN: SBOS-000000-000006-004228-000002
Disclaimer: Certain information contained herein is derived from information provided by parties other than Homes.com. All information provided is deemed reliable, but is not guaranteed to be accurate and should be independently verified.
![]() The property listing data and information, or the Images, set forth herein were provided to MLS Property Information Network, Inc. from third party sources, including sellers, lessors and public records, and were compiled by MLS Property Information Network, Inc. The property listing data and information, and the Images, are for the personal, non-commercial use of consumers having a good faith interest in purchasing or leasing listed properties of the type displayed to them and may not be used for any purpose other than to identify prospective properties which such consumers may have a good faith interest in purchasing or leasing. MLS Property Information Network, Inc. and its subscribers disclaim any and all representations and warranties as to the accuracy of the property listing data and information, or as to the accuracy of any of the Images, set forth herein.
The property listing data and information, or the Images, set forth herein were provided to MLS Property Information Network, Inc. from third party sources, including sellers, lessors and public records, and were compiled by MLS Property Information Network, Inc. The property listing data and information, and the Images, are for the personal, non-commercial use of consumers having a good faith interest in purchasing or leasing listed properties of the type displayed to them and may not be used for any purpose other than to identify prospective properties which such consumers may have a good faith interest in purchasing or leasing. MLS Property Information Network, Inc. and its subscribers disclaim any and all representations and warranties as to the accuracy of the property listing data and information, or as to the accuracy of any of the Images, set forth herein.