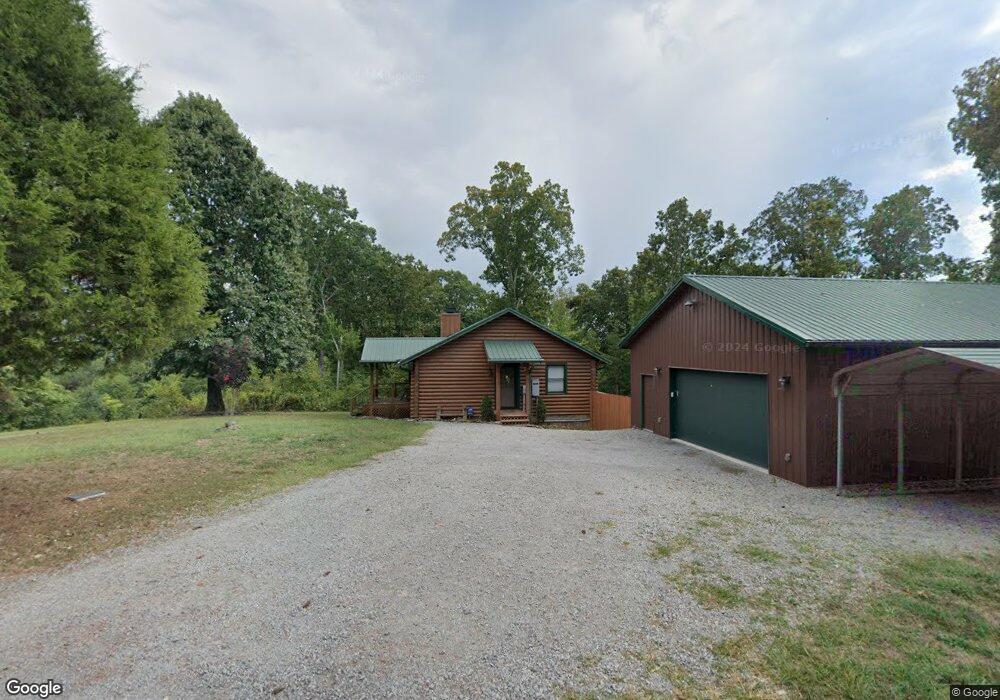
115 Oak Tree Dr Unit Spruce Drive Spring City, TN 37381
Estimated Value: $273,704 - $462,000
2
Beds
2
Baths
1,120
Sq Ft
$324/Sq Ft
Est. Value
About This Home
This home is located at 115 Oak Tree Dr Unit Spruce Drive, Spring City, TN 37381 and is currently estimated at $363,176, approximately $324 per square foot. 115 Oak Tree Dr Unit Spruce Drive is a home located in Rhea County with nearby schools including Rhea County High School.
Ownership History
Date
Name
Owned For
Owner Type
Purchase Details
Closed on
Aug 31, 2012
Sold by
Esgar Stacey D
Bought by
Mcintosh Lori L and Fleitz Steven E
Current Estimated Value
Home Financials for this Owner
Home Financials are based on the most recent Mortgage that was taken out on this home.
Original Mortgage
$124,200
Outstanding Balance
$85,982
Interest Rate
3.58%
Mortgage Type
Commercial
Estimated Equity
$277,194
Purchase Details
Closed on
Sep 4, 2007
Bought by
Esgar Stacey D
Purchase Details
Closed on
Jul 29, 2003
Bought by
Podlaha Francis J and Podlaha Martina
Purchase Details
Closed on
Apr 18, 1997
Sold by
Shook Reece Q
Bought by
Shook Paul A
Purchase Details
Closed on
Apr 7, 1997
Sold by
Shook Reece Q
Bought by
Shook Reece Q
Purchase Details
Closed on
Feb 25, 1964
Bought by
Davis Alvin J and Davis Clara L
Create a Home Valuation Report for This Property
The Home Valuation Report is an in-depth analysis detailing your home's value as well as a comparison with similar homes in the area
Home Values in the Area
Average Home Value in this Area
Purchase History
| Date | Buyer | Sale Price | Title Company |
|---|---|---|---|
| Mcintosh Lori L | $138,000 | -- | |
| Esgar Stacey D | $162,500 | -- | |
| Podlaha Francis J | $5,000 | -- | |
| Shook Paul A | $2,000 | -- | |
| Shook Reece Q | $2,000 | -- | |
| Davis Alvin J | -- | -- |
Source: Public Records
Mortgage History
| Date | Status | Borrower | Loan Amount |
|---|---|---|---|
| Open | Mcintosh Lori L | $124,200 |
Source: Public Records
Tax History Compared to Growth
Tax History
| Year | Tax Paid | Tax Assessment Tax Assessment Total Assessment is a certain percentage of the fair market value that is determined by local assessors to be the total taxable value of land and additions on the property. | Land | Improvement |
|---|---|---|---|---|
| 2024 | $729 | $54,075 | $8,750 | $45,325 |
| 2023 | $831 | $36,875 | $5,250 | $31,625 |
| 2022 | $831 | $36,875 | $5,250 | $31,625 |
| 2021 | $831 | $36,875 | $5,250 | $31,625 |
| 2020 | $831 | $36,875 | $5,250 | $31,625 |
| 2019 | $831 | $36,875 | $5,250 | $31,625 |
| 2018 | $727 | $33,100 | $5,250 | $27,850 |
| 2017 | $583 | $26,525 | $5,250 | $21,275 |
| 2016 | $583 | $26,525 | $5,250 | $21,275 |
| 2015 | $556 | $26,525 | $5,250 | $21,275 |
| 2014 | $556 | $26,525 | $5,250 | $21,275 |
| 2013 | -- | $26,525 | $5,250 | $21,275 |
Source: Public Records
Map
Nearby Homes
- 185 Oak Tree Rd
- 0 Cypress Dr Unit 20245236
- Lot 215 Hickory Dr
- 4.9 Acres Juniper Ct
- 0 Maple Dr Unit RTC2823363
- 0 Maple Dr Unit 1298937
- 0 Maple Dr Unit 20251864
- 0 Maple Dr Unit 1511820
- Lot 286 Maple Dr
- Lot 238 Hickory Dr
- 00 Hickory Dr
- 00 Dogwood Ct
- 0 Lakewood Village Dr
- 0 Lake Harbor Dr Unit 1316213
- 175 William Dr
- 495 Waterfront Way
- 0 Sherwood Shores Dr Unit RTC2796341
- 0 Sherwood Shores Dr Unit 1377769
- 3702 Toestring Valley Rd
- 886 Pin Hook Rd
- 115 Oak Tree Dr
- 130 Oak Tree Rd
- 130 Oak Tree Dr
- 130 Oak Tree Dr Unit 397 & 398
- 130 Oak Tree Dr
- 1478 Spruce Dr
- 152 Oak Tree Dr
- Lot 41 Oak Tree Dr
- 397 Oak Tree Dr
- 409 Oak Tree Dr
- Lot 418 Oak Tree Dr Unit 418
- Lot 418 Oak Tree Dr
- 418 Oak Tree Dr
- 1460 Spruce Dr
- Lot #424 Pecan Dr
- Lot 399 Oak Tree Dr
- 1 Pecan Dr
- lot 424 Pecan Dr
- 1414 Spruce Dr
- 0 Oak Tree Dr Unit 20223122