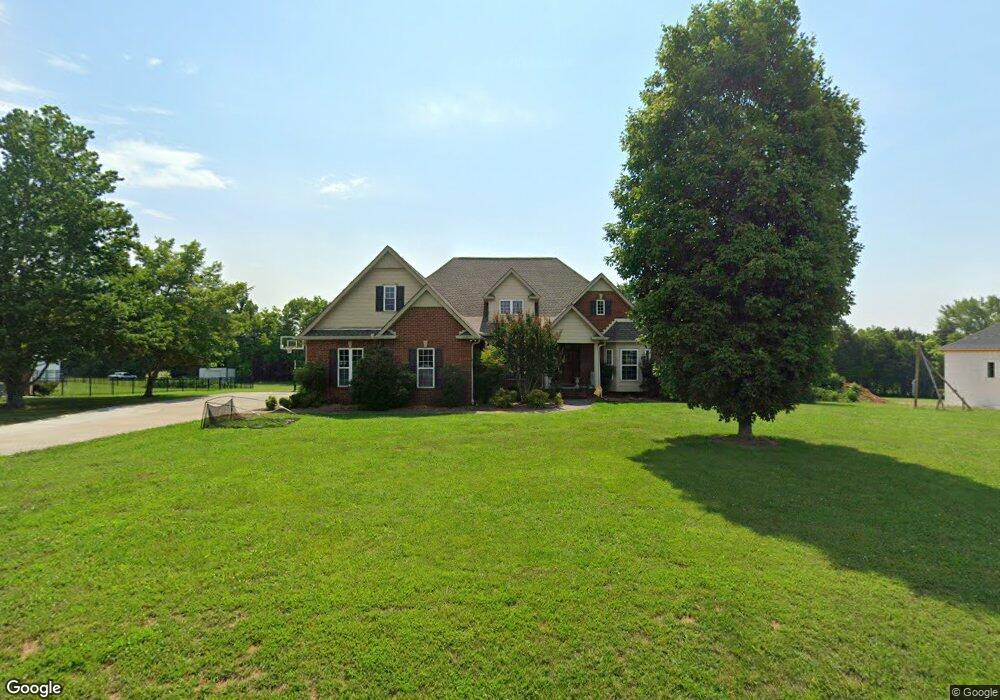
115 Peggy Ln Shelbyville, TN 37160
Estimated Value: $569,000 - $830,000
4
Beds
3
Baths
2,742
Sq Ft
$234/Sq Ft
Est. Value
About This Home
This home is located at 115 Peggy Ln, Shelbyville, TN 37160 and is currently estimated at $640,557, approximately $233 per square foot. 115 Peggy Ln is a home located in Bedford County with nearby schools including Liberty Elementary School.
Ownership History
Date
Name
Owned For
Owner Type
Purchase Details
Closed on
Nov 8, 2024
Sold by
2 Title Llc
Bought by
Amerisave Mortgage Corporation
Current Estimated Value
Purchase Details
Closed on
Mar 29, 2024
Sold by
Hammonds Joshua K
Bought by
Hammonds Anissa M
Purchase Details
Closed on
Jul 10, 2006
Sold by
Mullaney Matthew
Bought by
Hammonds Anissa M
Home Financials for this Owner
Home Financials are based on the most recent Mortgage that was taken out on this home.
Original Mortgage
$236,000
Interest Rate
6.54%
Purchase Details
Closed on
Jun 3, 2003
Sold by
Daniel Bill
Bought by
Mullaney Matthew and Mullaney Michelle
Purchase Details
Closed on
Apr 14, 1976
Bought by
Daniel Bill
Create a Home Valuation Report for This Property
The Home Valuation Report is an in-depth analysis detailing your home's value as well as a comparison with similar homes in the area
Home Values in the Area
Average Home Value in this Area
Purchase History
| Date | Buyer | Sale Price | Title Company |
|---|---|---|---|
| Amerisave Mortgage Corporation | $415,000 | None Listed On Document | |
| Amerisave Mortgage Corporation | $415,000 | None Listed On Document | |
| Hammonds Anissa M | -- | None Listed On Document | |
| Hammonds Anissa M | $295,000 | -- | |
| Mullaney Matthew | $17,500 | -- | |
| Daniel Bill | -- | -- |
Source: Public Records
Mortgage History
| Date | Status | Borrower | Loan Amount |
|---|---|---|---|
| Previous Owner | Daniel Bill | $236,000 |
Source: Public Records
Tax History Compared to Growth
Tax History
| Year | Tax Paid | Tax Assessment Tax Assessment Total Assessment is a certain percentage of the fair market value that is determined by local assessors to be the total taxable value of land and additions on the property. | Land | Improvement |
|---|---|---|---|---|
| 2025 | $2,422 | $104,175 | $0 | $0 |
| 2024 | $2,422 | $104,175 | $6,825 | $97,350 |
| 2023 | $2,422 | $104,175 | $6,825 | $97,350 |
| 2022 | $2,422 | $104,175 | $6,825 | $97,350 |
| 2021 | $2,047 | $104,175 | $6,825 | $97,350 |
| 2020 | $2,138 | $104,175 | $6,825 | $97,350 |
| 2019 | $2,138 | $80,375 | $5,500 | $74,875 |
| 2018 | $2,058 | $80,375 | $5,500 | $74,875 |
| 2017 | $2,058 | $80,375 | $5,500 | $74,875 |
| 2016 | $2,025 | $80,375 | $5,500 | $74,875 |
| 2015 | $2,025 | $80,375 | $5,500 | $74,875 |
| 2014 | $1,640 | $72,245 | $0 | $0 |
Source: Public Records
Map
Nearby Homes