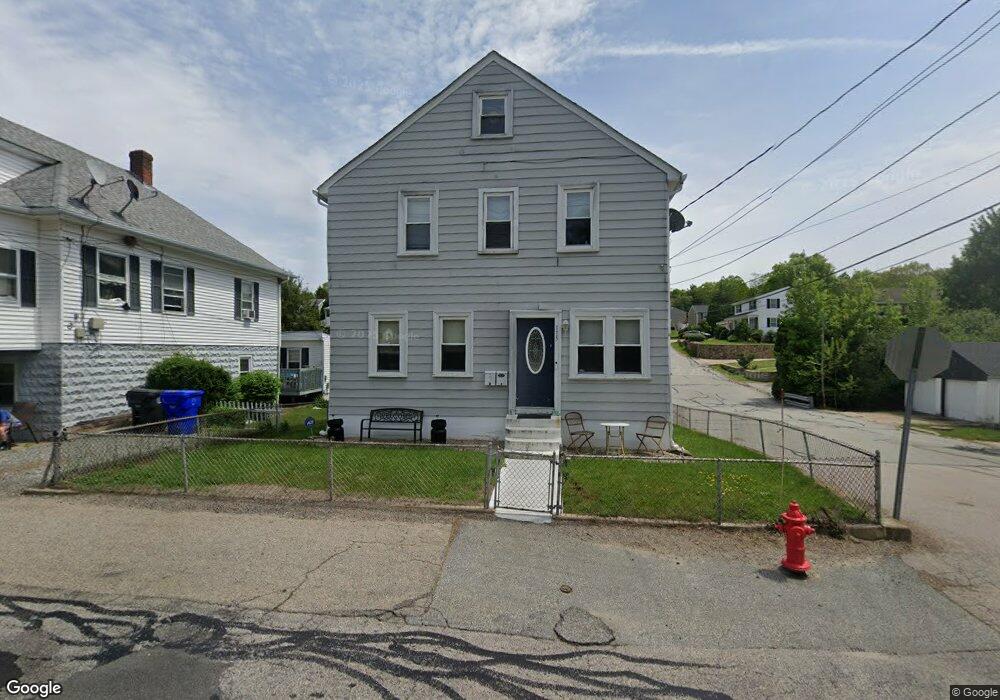
115 Phenix Ave West Warwick, RI 02893
Lippitt-Harris NeighborhoodEstimated Value: $450,000 - $565,000
6
Beds
2
Baths
3,080
Sq Ft
$165/Sq Ft
Est. Value
About This Home
This home is located at 115 Phenix Ave, West Warwick, RI 02893 and is currently estimated at $507,526, approximately $164 per square foot. 115 Phenix Ave is a home located in Kent County with nearby schools including West Warwick High School, St Joseph School, and Islamic School of Rhode Island.
Ownership History
Date
Name
Owned For
Owner Type
Purchase Details
Closed on
Oct 26, 2007
Sold by
Ciccarone Anthony P
Bought by
Till Brian J
Current Estimated Value
Home Financials for this Owner
Home Financials are based on the most recent Mortgage that was taken out on this home.
Original Mortgage
$247,000
Outstanding Balance
$156,360
Interest Rate
6.39%
Mortgage Type
Purchase Money Mortgage
Estimated Equity
$351,166
Purchase Details
Closed on
Jan 16, 2002
Sold by
Pacheco Janice
Bought by
Palmer Tyrandia T
Create a Home Valuation Report for This Property
The Home Valuation Report is an in-depth analysis detailing your home's value as well as a comparison with similar homes in the area
Home Values in the Area
Average Home Value in this Area
Purchase History
| Date | Buyer | Sale Price | Title Company |
|---|---|---|---|
| Till Brian J | $260,000 | -- | |
| Palmer Tyrandia T | $135,000 | -- |
Source: Public Records
Mortgage History
| Date | Status | Borrower | Loan Amount |
|---|---|---|---|
| Open | Palmer Tyrandia T | $25,000 | |
| Open | Palmer Tyrandia T | $247,000 | |
| Previous Owner | Palmer Tyrandia T | $152,000 | |
| Previous Owner | Palmer Tyrandia T | $136,000 |
Source: Public Records
Tax History Compared to Growth
Tax History
| Year | Tax Paid | Tax Assessment Tax Assessment Total Assessment is a certain percentage of the fair market value that is determined by local assessors to be the total taxable value of land and additions on the property. | Land | Improvement |
|---|---|---|---|---|
| 2025 | $6,608 | $462,400 | $85,900 | $376,500 |
| 2024 | $6,459 | $345,600 | $70,200 | $275,400 |
| 2023 | $6,331 | $345,600 | $70,200 | $275,400 |
| 2022 | $6,235 | $345,600 | $70,200 | $275,400 |
| 2021 | $5,407 | $235,100 | $59,000 | $176,100 |
| 2020 | $5,407 | $235,100 | $59,000 | $176,100 |
| 2019 | $6,893 | $235,100 | $59,000 | $176,100 |
| 2018 | $5,265 | $193,700 | $56,500 | $137,200 |
| 2017 | $5,096 | $193,700 | $56,500 | $137,200 |
| 2016 | $5,005 | $193,700 | $56,500 | $137,200 |
| 2015 | $4,829 | $186,000 | $56,500 | $129,500 |
| 2014 | $1,181 | $186,000 | $56,500 | $129,500 |
Source: Public Records
Map
Nearby Homes