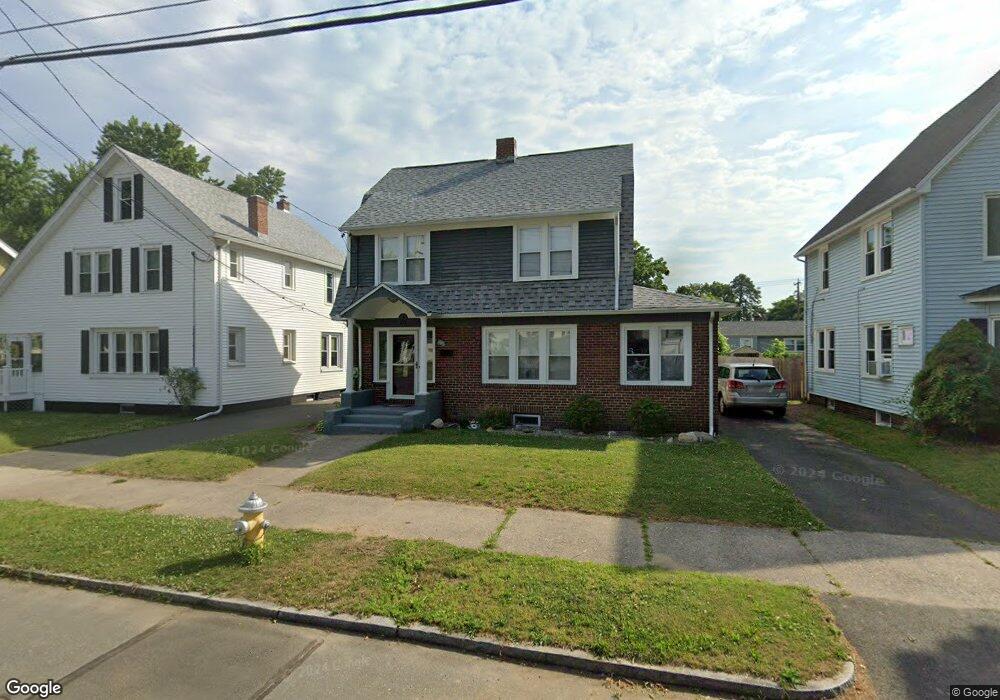
115 Prentice St Springfield, MA 01104
East Springfield NeighborhoodEstimated Value: $247,000 - $313,000
3
Beds
1
Bath
1,329
Sq Ft
$211/Sq Ft
Est. Value
About This Home
This home is located at 115 Prentice St, Springfield, MA 01104 and is currently estimated at $280,792, approximately $211 per square foot. 115 Prentice St is a home located in Hampden County with nearby schools including Van Sickle Academy, Springfield Central High School, and Roger L. Putnam Vocational Technical Academy.
Ownership History
Date
Name
Owned For
Owner Type
Purchase Details
Closed on
Apr 20, 2004
Sold by
Hollins Charles W and Murphy Joanne F
Bought by
Hollins Charles W and Hollins Joanne F
Current Estimated Value
Purchase Details
Closed on
Dec 21, 1999
Sold by
John J Reilly Iv Est
Bought by
Hollins Charles W and Murphy Joanne F
Home Financials for this Owner
Home Financials are based on the most recent Mortgage that was taken out on this home.
Original Mortgage
$81,288
Interest Rate
7.81%
Mortgage Type
Purchase Money Mortgage
Purchase Details
Closed on
Dec 30, 1992
Sold by
Oshea Frances H and Oshea Maura C
Bought by
Reilly John J
Home Financials for this Owner
Home Financials are based on the most recent Mortgage that was taken out on this home.
Original Mortgage
$37,000
Interest Rate
8.32%
Mortgage Type
Purchase Money Mortgage
Create a Home Valuation Report for This Property
The Home Valuation Report is an in-depth analysis detailing your home's value as well as a comparison with similar homes in the area
Home Values in the Area
Average Home Value in this Area
Purchase History
| Date | Buyer | Sale Price | Title Company |
|---|---|---|---|
| Hollins Charles W | -- | -- | |
| Hollins Charles W | $82,000 | -- | |
| Reilly John J | $26,500 | -- | |
| Reilly John C | $26,500 | -- |
Source: Public Records
Mortgage History
| Date | Status | Borrower | Loan Amount |
|---|---|---|---|
| Previous Owner | Reilly John C | $81,288 | |
| Previous Owner | Reilly John C | $25,000 | |
| Previous Owner | Reilly John C | $37,000 |
Source: Public Records
Tax History
| Year | Tax Paid | Tax Assessment Tax Assessment Total Assessment is a certain percentage of the fair market value that is determined by local assessors to be the total taxable value of land and additions on the property. | Land | Improvement |
|---|---|---|---|---|
| 2025 | $3,644 | $232,400 | $37,200 | $195,200 |
| 2024 | $3,585 | $223,200 | $37,200 | $186,000 |
| 2023 | $3,354 | $196,700 | $34,700 | $162,000 |
| 2022 | $3,440 | $182,800 | $32,400 | $150,400 |
| 2021 | $3,164 | $167,400 | $29,500 | $137,900 |
| 2020 | $3,060 | $156,700 | $29,500 | $127,200 |
| 2019 | $3,060 | $155,500 | $30,500 | $125,000 |
| 2018 | $2,724 | $138,400 | $30,500 | $107,900 |
| 2017 | $2,631 | $133,800 | $27,600 | $106,200 |
| 2016 | $2,485 | $126,400 | $27,600 | $98,800 |
| 2015 | $2,571 | $130,700 | $27,600 | $103,100 |
Source: Public Records
Map
Nearby Homes
- 147 Bowles Park
- 66 Thornton St
- 126 Windemere St
- 2408 Roosevelt Ave
- 114 Monrovia St
- 70 Chateaugay St
- 58 Eureka St
- 456-458 Page Blvd
- 104 Chateaugay St
- 152 Monrovia St
- 158 Monrovia St
- 200 El Paso St
- 105 Lachine St
- 112 W Canton Cir
- 191 Monrovia St
- 3 Fordham St
- 47 Holy Cross St
- 181 Beauchamp Terrace
- 42 Marquette St
- 83 Oklahoma St
- 119 Prentice St
- 109 Prentice St
- 125 Prentice St
- 179 East St
- 185 East St
- 105 Prentice St
- 173 East St
- 193 East St
- 129 Prentice St Unit 131
- 169 East St
- 122 Prentice St
- 199 East St
- 95 Prentice St
- 126 Prentice St
- 135 Prentice St
- 130 Prentice St Unit 132
- 99 Jenness St
- 163 East St
- 205 East St
- 116 Jenness St
Your Personal Tour Guide
Ask me questions while you tour the home.