
K
Seller's Agent in 2025
Kathy Carson
All-American Realty
(217) 276-0791
27 Total Sales
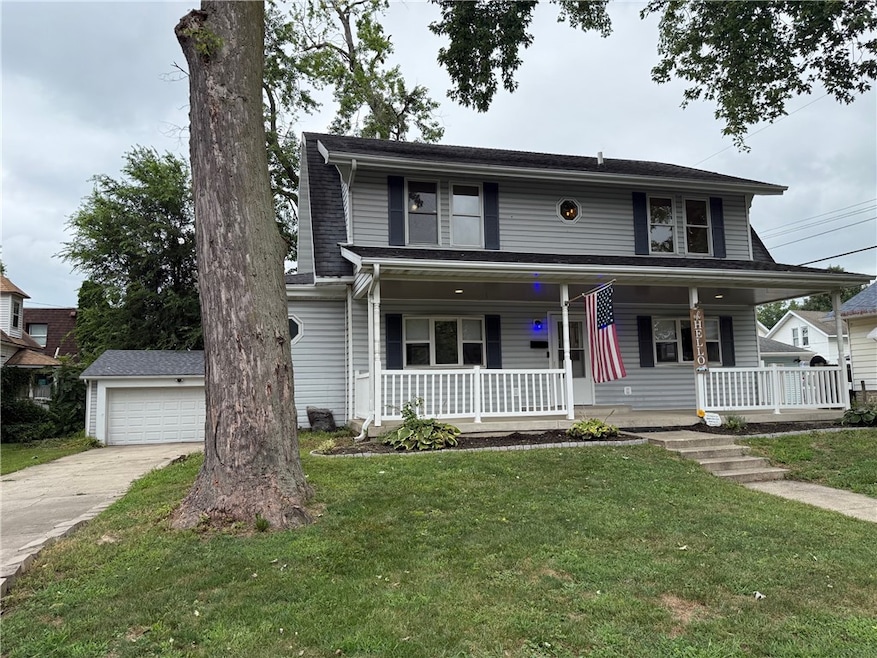
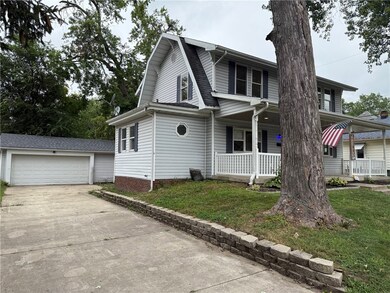
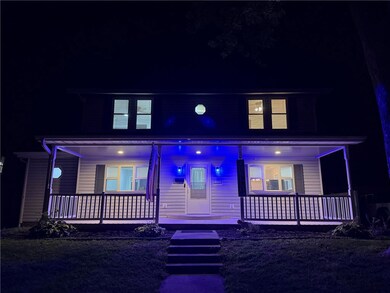
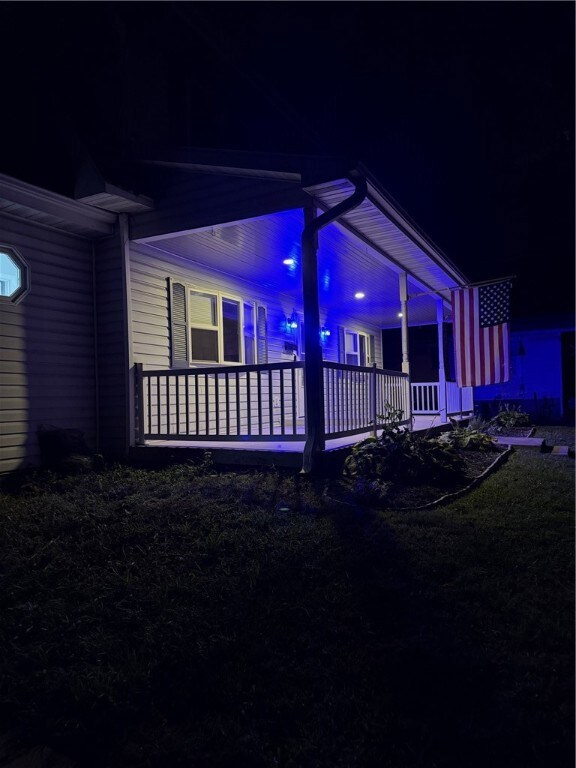
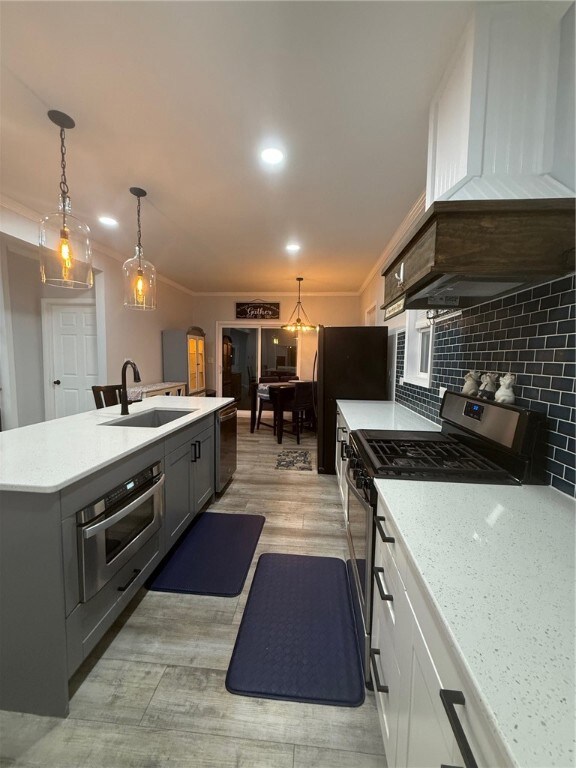
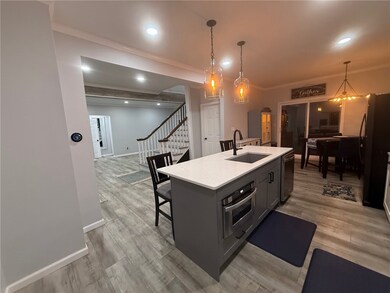
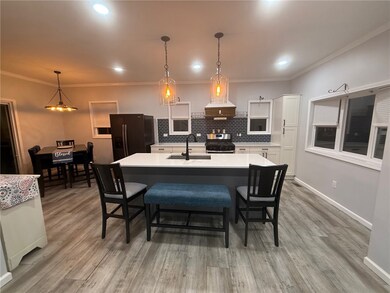
Just steps from Western Avenue and a short walk on nice sidewalks to Lytle Park, you will find this beautiful 3 bedroom home with 2.5 bathrooms. This stunning home is completely remodeled and move in ready. The main floor features an open concept family room with gas burning fireplace that has quaint built-in storage benches on each side. The open dining room is nicely located by the brand new deck and backyard, with a new pretty privacy vinyl fence. The gorgeous kitchen boasts a beautiful 8 foot granite island, newer appliances and quality cabinetry. Two bay windows look out on to the spacious covered inviting front porch. The main floor also features a fully updated 1/2 bath and laundry room, complete with a sink. The second floor has 2 bedrooms with a fully renovated full bathroom. The master bedroom has a fully updated beautiful master bathroom and walk-in-closet. Plenty of storage with a 2 car detached garage and a full unfinished basement. New central air and updated plumbing/electric/HVAC. A must See!
Last Agent to Sell the Property
All-American Realty License #475136042 Listed on: 07/31/2025
| Date | Type | Sale Price | Title Company |
|---|---|---|---|
| Warranty Deed | $200,000 | None Listed On Document | |
| Warranty Deed | $91,333 | -- | |
| Sheriffs Deed | -- | None Available | |
| Warranty Deed | $84,500 | None Available |
| Date | Status | Loan Amount | Loan Type |
|---|---|---|---|
| Previous Owner | $139,000 | New Conventional | |
| Previous Owner | $83,751 | FHA |
| Date | Event | Price | List to Sale | Price per Sq Ft |
|---|---|---|---|---|
| 09/24/2025 09/24/25 | Sold | $200,000 | 0.0% | $111 / Sq Ft |
| 08/27/2025 08/27/25 | Pending | -- | -- | -- |
| 07/31/2025 07/31/25 | For Sale | $200,000 | -- | $111 / Sq Ft |
| Year | Tax Paid | Tax Assessment Tax Assessment Total Assessment is a certain percentage of the fair market value that is determined by local assessors to be the total taxable value of land and additions on the property. | Land | Improvement |
|---|---|---|---|---|
| 2024 | $2,907 | $34,158 | $2,903 | $31,255 |
| 2023 | $2,700 | $30,498 | $2,592 | $27,906 |
| 2022 | $2,626 | $29,994 | $2,549 | $27,445 |
| 2021 | $2,634 | $27,550 | $2,341 | $25,209 |
| 2020 | $2,058 | $28,545 | $2,426 | $26,119 |
| 2019 | $2,007 | $27,550 | $2,341 | $25,209 |
| 2018 | $1,972 | $27,550 | $2,341 | $25,209 |
| 2017 | $1,965 | $27,550 | $2,341 | $25,209 |
| 2016 | $1,924 | $27,550 | $2,341 | $25,209 |
| 2015 | $1,898 | $27,550 | $2,341 | $25,209 |
| 2014 | $1,898 | $27,550 | $2,341 | $25,209 |
| 2013 | $1,898 | $27,550 | $2,341 | $25,209 |
K
Seller's Agent in 2025
Kathy Carson
All-American Realty
(217) 276-0791
27 Total Sales
D
Buyer's Agent in 2025
Debbie Waggoner
Coldwell Banker Classic Real Estate
(217) 258-4663
144 Total Sales
Source: Central Illinois Board of REALTORS®
MLS Number: 6254385
APN: 07-2-10989-000