
Seller's Agent in 2021
Sarah Huard
Mott & Chace Sotheby's Intl.
(401) 255-2578
1 in this area
163 Total Sales
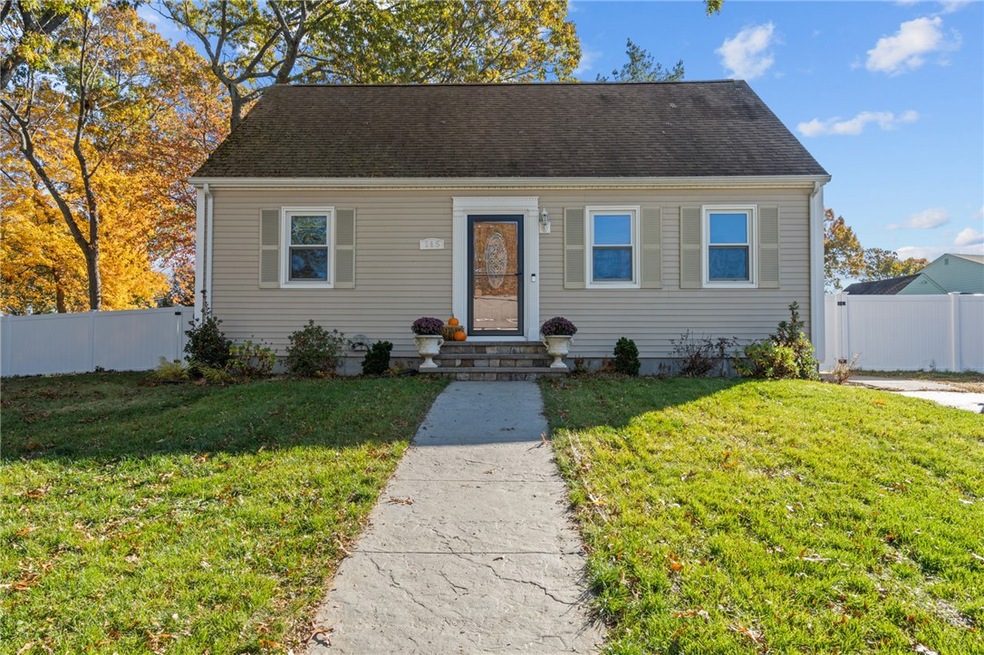
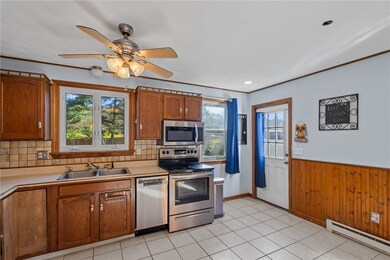
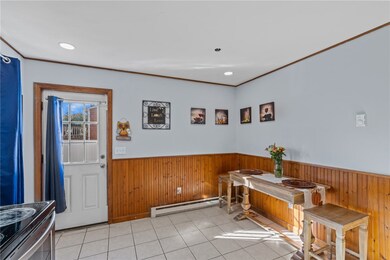
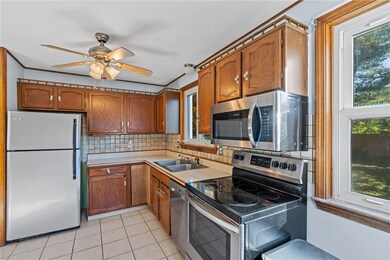
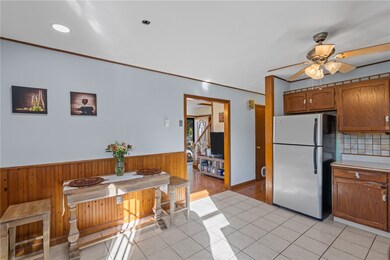
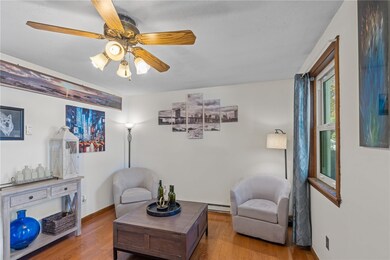
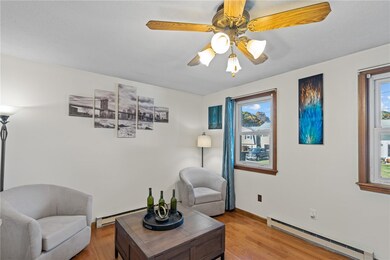
Welcome to this spacious Cape located in the desirable Campbell Farms neighborhood of West Warwick. This home boasts 4 generous bedrooms; one of which could be used for an ideal home office and two full bathrooms! Enjoy a recently finished basement with a built-in dehumidifying system with two areas that could serve as additional entertaining space or an ideal workout and/or gaming area. Recent improvements include a new dishwasher, washer, dryer & hot water tank and a fully revamped exterior lot including a new fence, landscaping and a stellar custom patio with a fire pit and lights. All of which furthers the value and enjoyment factor of this cute Cape! Come enjoy comfortable suburban living in this quaint home nestled in a very appealing neighborhood, while benefiting from the convenience of being close to a plethora of shops, restaurants and easy highway access!
Last Agent to Sell the Property
Mott & Chace Sotheby's Intl. License #RES.0041951 Listed on: 11/08/2021
| Date | Type | Sale Price | Title Company |
|---|---|---|---|
| Quit Claim Deed | -- | None Available | |
| Warranty Deed | $330,000 | None Available | |
| Warranty Deed | $250,000 | None Available | |
| Warranty Deed | $160,000 | -- | |
| Foreclosure Deed | $4,022 | -- | |
| Foreclosure Deed | $3,525 | -- | |
| Foreclosure Deed | $3,525 | -- |
| Date | Status | Loan Amount | Loan Type |
|---|---|---|---|
| Previous Owner | $297,000 | Purchase Money Mortgage | |
| Previous Owner | $237,500 | New Conventional | |
| Previous Owner | $155,200 | New Conventional | |
| Previous Owner | $4,800 | No Value Available |
| Date | Event | Price | Change | Sq Ft Price |
|---|---|---|---|---|
| 12/16/2021 12/16/21 | Sold | $330,000 | +3.1% | $163 / Sq Ft |
| 11/16/2021 11/16/21 | Pending | -- | -- | -- |
| 11/08/2021 11/08/21 | For Sale | $320,000 | +28.0% | $158 / Sq Ft |
| 05/29/2020 05/29/20 | Sold | $250,000 | -3.8% | $123 / Sq Ft |
| 04/29/2020 04/29/20 | Pending | -- | -- | -- |
| 03/10/2020 03/10/20 | For Sale | $259,900 | +62.4% | $128 / Sq Ft |
| 04/25/2013 04/25/13 | Sold | $160,000 | -8.5% | $115 / Sq Ft |
| 03/26/2013 03/26/13 | Pending | -- | -- | -- |
| 02/07/2013 02/07/13 | For Sale | $174,900 | -- | $126 / Sq Ft |
| Year | Tax Paid | Tax Assessment Tax Assessment Total Assessment is a certain percentage of the fair market value that is determined by local assessors to be the total taxable value of land and additions on the property. | Land | Improvement |
|---|---|---|---|---|
| 2025 | $4,857 | $339,900 | $112,000 | $227,900 |
| 2024 | $5,252 | $281,000 | $88,500 | $192,500 |
| 2023 | $5,148 | $281,000 | $88,500 | $192,500 |
| 2022 | $5,069 | $281,000 | $88,500 | $192,500 |
| 2021 | $5,389 | $234,300 | $70,800 | $163,500 |
| 2020 | $5,389 | $234,300 | $70,800 | $163,500 |
| 2019 | $6,870 | $234,300 | $70,800 | $163,500 |
| 2018 | $4,566 | $172,900 | $68,700 | $104,200 |
| 2017 | $4,549 | $172,900 | $68,700 | $104,200 |
| 2016 | $4,468 | $172,900 | $68,700 | $104,200 |
| 2015 | $4,257 | $164,000 | $68,700 | $95,300 |
| 2014 | $4,164 | $164,000 | $68,700 | $95,300 |
Seller's Agent in 2021
Sarah Huard
Mott & Chace Sotheby's Intl.
(401) 255-2578
1 in this area
163 Total Sales
Buyer's Agent in 2021
Kate DeSimone
Williams & Stuart Real Estate
(401) 450-4881
4 in this area
101 Total Sales
Seller's Agent in 2020
Adam Wilks
Keller Williams Coastal
(401) 419-9502
4 in this area
190 Total Sales
J
Seller's Agent in 2013
Jeremy Marcotte
HomeSmart Professionals
2 in this area
13 Total Sales
D
Buyer's Agent in 2013
Dena Conley
Williams & Stuart Real Estate
(401) 952-0664
31 Total Sales
Source: State-Wide MLS
MLS Number: 1296948
APN: WWAR-000011-000571-000000
Disclaimer: Certain information contained herein is derived from information provided by parties other than Homes.com. All information provided is deemed reliable, but is not guaranteed to be accurate and should be independently verified.
![]() IDX information is provided exclusively for personal, non-commercial use, and may not be used for any purpose other than to identify prospective properties consumers may be interested in purchasing. Information is deemed reliable but not guaranteed.
IDX information is provided exclusively for personal, non-commercial use, and may not be used for any purpose other than to identify prospective properties consumers may be interested in purchasing. Information is deemed reliable but not guaranteed.
Copyright © 2025 State-Wide MLS, Inc. All rights reserved.