115 Stornoway Dr E Unit 115 Columbus, OH 43213
Olde Orchard NeighborhoodEstimated Value: $145,000 - $164,000
2
Beds
2
Baths
1,320
Sq Ft
$117/Sq Ft
Est. Value
About This Home
This home is located at 115 Stornoway Dr E Unit 115, Columbus, OH 43213 and is currently estimated at $154,200, approximately $116 per square foot. 115 Stornoway Dr E Unit 115 is a home located in Franklin County with nearby schools including Olde Orchard Elementary School, Sherwood Middle School, and Walnut Ridge High School.
Ownership History
Date
Name
Owned For
Owner Type
Purchase Details
Closed on
May 20, 2011
Sold by
Shaw Christopher M and Shaw Alicia Nesline
Bought by
Hollanda Shaw Llc
Current Estimated Value
Purchase Details
Closed on
Jul 7, 2006
Sold by
Steele S and Schear Remington Trust
Bought by
Shaw Christopher M
Home Financials for this Owner
Home Financials are based on the most recent Mortgage that was taken out on this home.
Original Mortgage
$44,000
Interest Rate
6.73%
Mortgage Type
Purchase Money Mortgage
Purchase Details
Closed on
Jun 23, 2006
Sold by
Hanley Kathleen A and Skeen Marian
Bought by
Steele S and The Schear Remington Trust
Home Financials for this Owner
Home Financials are based on the most recent Mortgage that was taken out on this home.
Original Mortgage
$44,000
Interest Rate
6.73%
Mortgage Type
Purchase Money Mortgage
Purchase Details
Closed on
Aug 25, 1997
Sold by
Hanley Kathleen A Trustee
Bought by
Hanley Kathleen A and Skeen Marian
Purchase Details
Closed on
Jan 30, 1997
Sold by
Hunderliter Michael H
Bought by
Kathleen A Hanley Trustee
Purchase Details
Closed on
Nov 1, 1984
Create a Home Valuation Report for This Property
The Home Valuation Report is an in-depth analysis detailing your home's value as well as a comparison with similar homes in the area
Home Values in the Area
Average Home Value in this Area
Purchase History
| Date | Buyer | Sale Price | Title Company |
|---|---|---|---|
| Hollanda Shaw Llc | $64,900 | Valmer | |
| Shaw Christopher M | $55,000 | Marketable | |
| Steele S | $30,500 | Avery Title | |
| Hanley Kathleen A | $44,000 | -- | |
| Kathleen A Hanley Trustee | $44,000 | -- | |
| -- | $47,400 | -- |
Source: Public Records
Mortgage History
| Date | Status | Borrower | Loan Amount |
|---|---|---|---|
| Previous Owner | Shaw Christopher M | $44,000 |
Source: Public Records
Tax History
| Year | Tax Paid | Tax Assessment Tax Assessment Total Assessment is a certain percentage of the fair market value that is determined by local assessors to be the total taxable value of land and additions on the property. | Land | Improvement |
|---|---|---|---|---|
| 2025 | $2,137 | $46,630 | $9,980 | $36,650 |
| 2024 | $2,137 | $46,630 | $9,980 | $36,650 |
| 2023 | $2,110 | $46,620 | $9,975 | $36,645 |
| 2022 | $1,168 | $21,980 | $3,640 | $18,340 |
| 2021 | $1,170 | $21,980 | $3,640 | $18,340 |
| 2020 | $1,172 | $21,980 | $3,640 | $18,340 |
| 2019 | $1,052 | $16,910 | $2,800 | $14,110 |
| 2018 | $1,095 | $16,910 | $2,800 | $14,110 |
| 2017 | $1,051 | $16,910 | $2,800 | $14,110 |
| 2016 | $1,251 | $18,420 | $2,770 | $15,650 |
| 2015 | $1,139 | $18,420 | $2,770 | $15,650 |
| 2014 | $1,142 | $18,420 | $2,770 | $15,650 |
| 2013 | $663 | $21,665 | $3,255 | $18,410 |
Source: Public Records
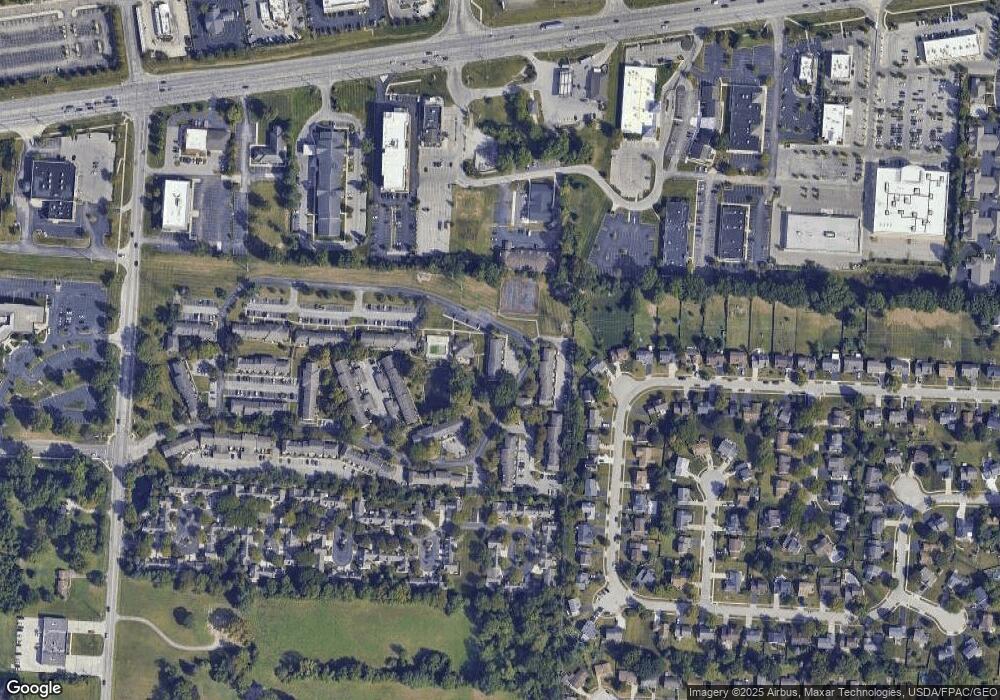
Map
Nearby Homes
- 86 Stornoway Dr W Unit 86
- 6224 McNaughten Place Ln Unit S57
- 85 Stornoway Dr W Unit 85
- 145 Shadymere Ln Unit 5
- 142 Villamere Dr Unit 6
- 6204 Marias Point Ln
- 445 Hawthorne Place
- 6560 Schenk Ave
- 6571 Schenk Ave
- 491 Durbin Rd Unit A
- 524 Woodingham Place Unit 3-B
- 5910 Rock Hill Rd
- 6279 Braiden Ct Unit B
- 71 Villa Side Ln
- 622 Brice Rd
- 324 Benedetti Ave
- 362 Hoskins Way
- 787 Persimmon Place
- 5825 Bastille Place Unit 69
- 5719 Notre Dame Place Unit 11
- 113 Stornoway Dr E Unit 113
- 111 Stornoway Dr E
- 119 Stornoway Dr E
- 119 Stornoway Dr W Unit 119
- 121 Stornoway Dr E
- 116 Stornoway Dr E
- 120 Stornoway Dr E
- 122 Stornoway Dr E
- 132 Stornoway Dr E Unit B
- 132 Stornoway Dr E Unit 132A
- 132 Stornoway Dr E
- 132 Stornoway Dr S Unit A/B
- 132 Stornoway Dr E Unit A
- 124 Stornoway Dr E
- 126 Stornoway Dr E
- 134 Stornoway Dr E Unit B
- 134 Stornoway Dr E Unit 134A
- 134 Stornoway Dr E Unit A
- 128 Stornoway Dr E Unit 2
- 6230 Stornoway Dr S Unit 6230
Your Personal Tour Guide
Ask me questions while you tour the home.